Query Tester
On this page:
The information contained in this doc is specific to the Integrator PortalAll information contained in this section of the docs pertains specifically to actions that can be taken through the Integrator Portal.
What is the Query Tester?
The Query Tester is available in the Integrator Portal only. It is a minimalist version of our open-source Data Messenger-style chat widget that allows you to easily test out queries in an isolated environment.
In the Query Tester, you can enter natural language queries to see the Query Response that is generated, view the Generated SQL (the SQL statement dynamically produced by AutoQL), and review details of the Network Response.
This environment is particularly useful for reviewing and testing out recently-trained queries or comparing similar queries between different Projects.
The Query Tester only supports querying in Sandbox projectsThis feature is built to function as a testing environment for developers. Any queries that are input and tested in the Query Tester will not alter or affect your Production Projects/Production Data.
Accessing the Query Tester
To access the Query Tester, navigate to "Query Tester" in the "Dev Tools" section of the navigation menu within the Integrator Portal and select a Project to get started.
Using the Query Tester
Using the Query Tester is straightforward and simple.
Begin by selecting a Project from the list. Once you've clicked on a Project, the chat-style interface will open for you. Next, enter a natural language query in the search bar at the bottom of the screen.
Looking for tips on querying with AutoQL?For tips on how to ask great queries, check out our Data Messenger and Dashboards User Guides.
Any valid/trained query will return a data response from the database within just a couple of seconds.
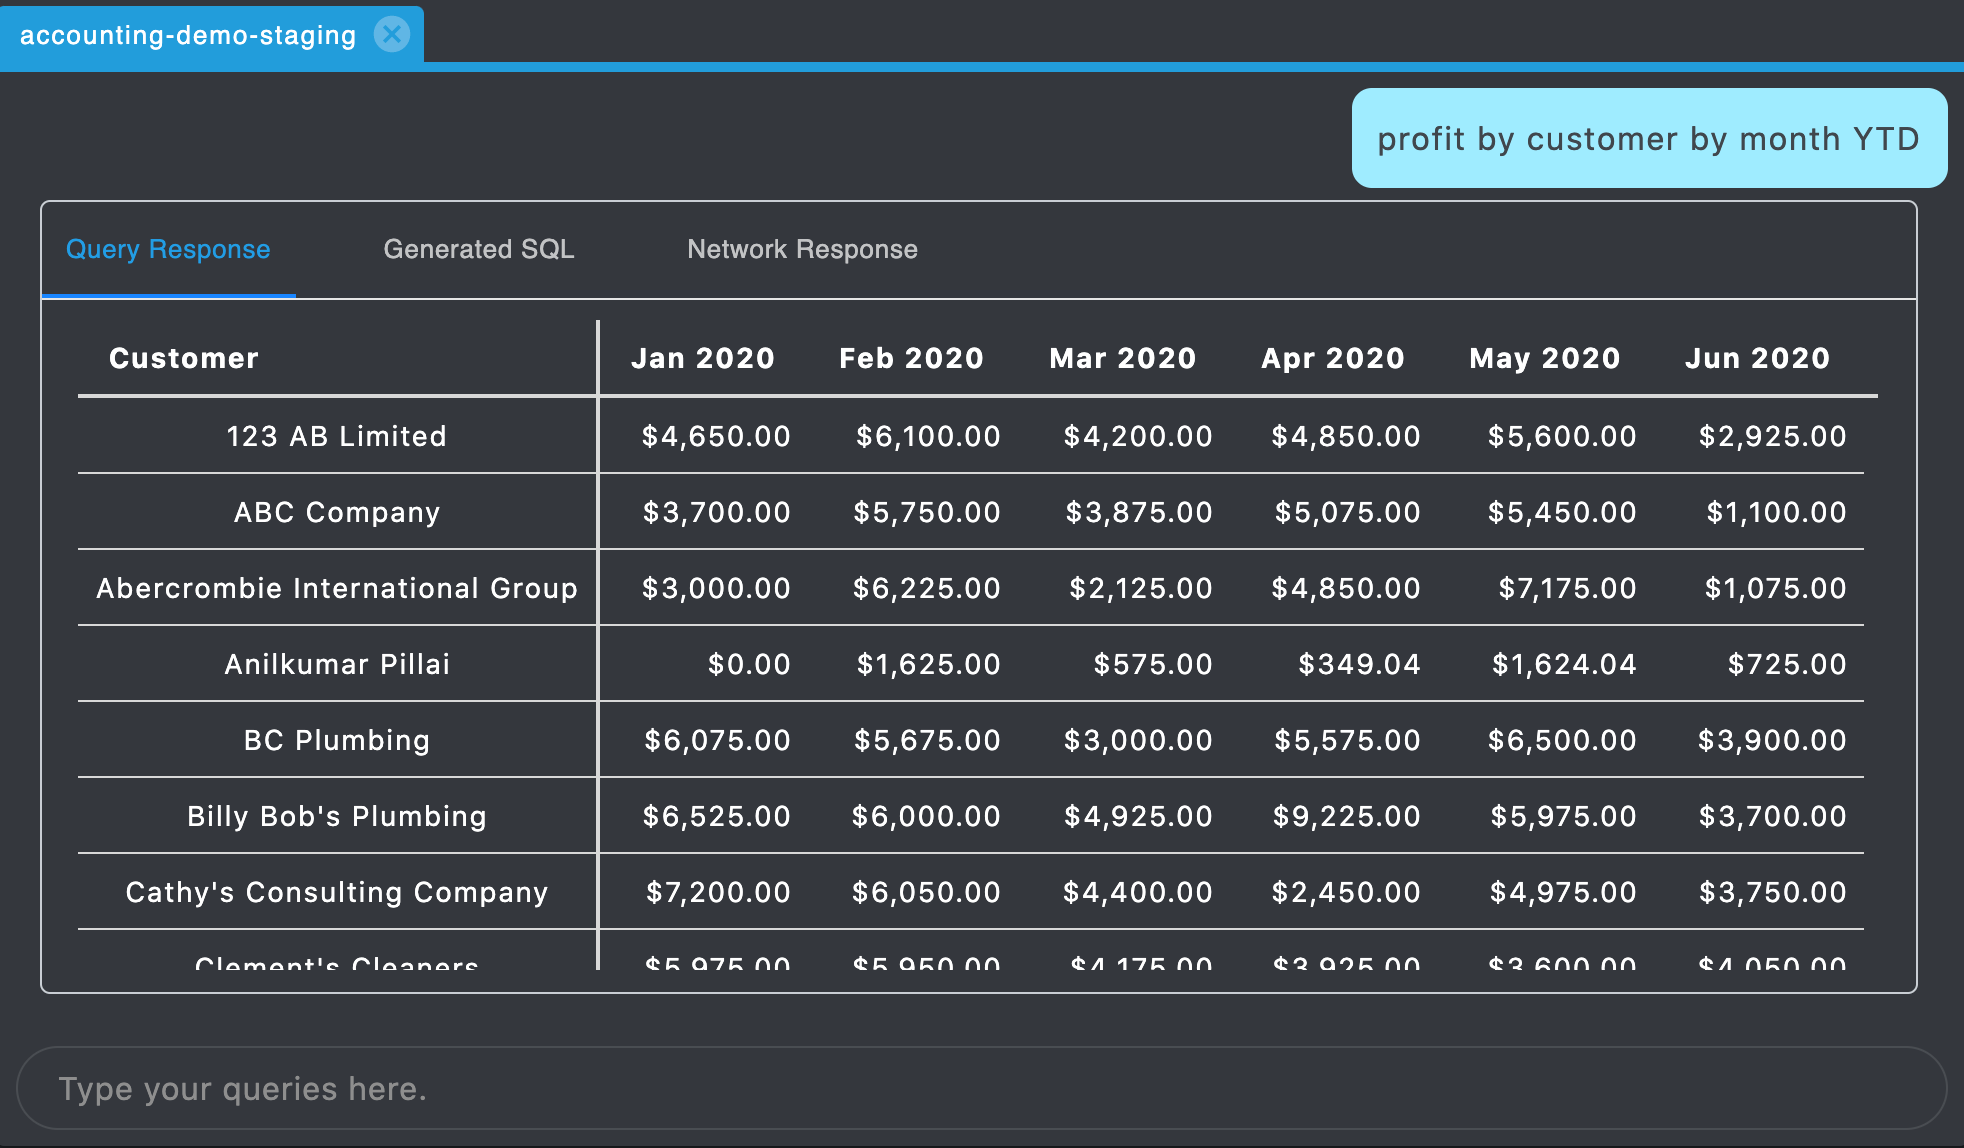
Natural Language Query and Query Response
Once you've received a response, toggle between each of the tabs to view each of the respective response types (Query Response, Generated SQL, Network Response).
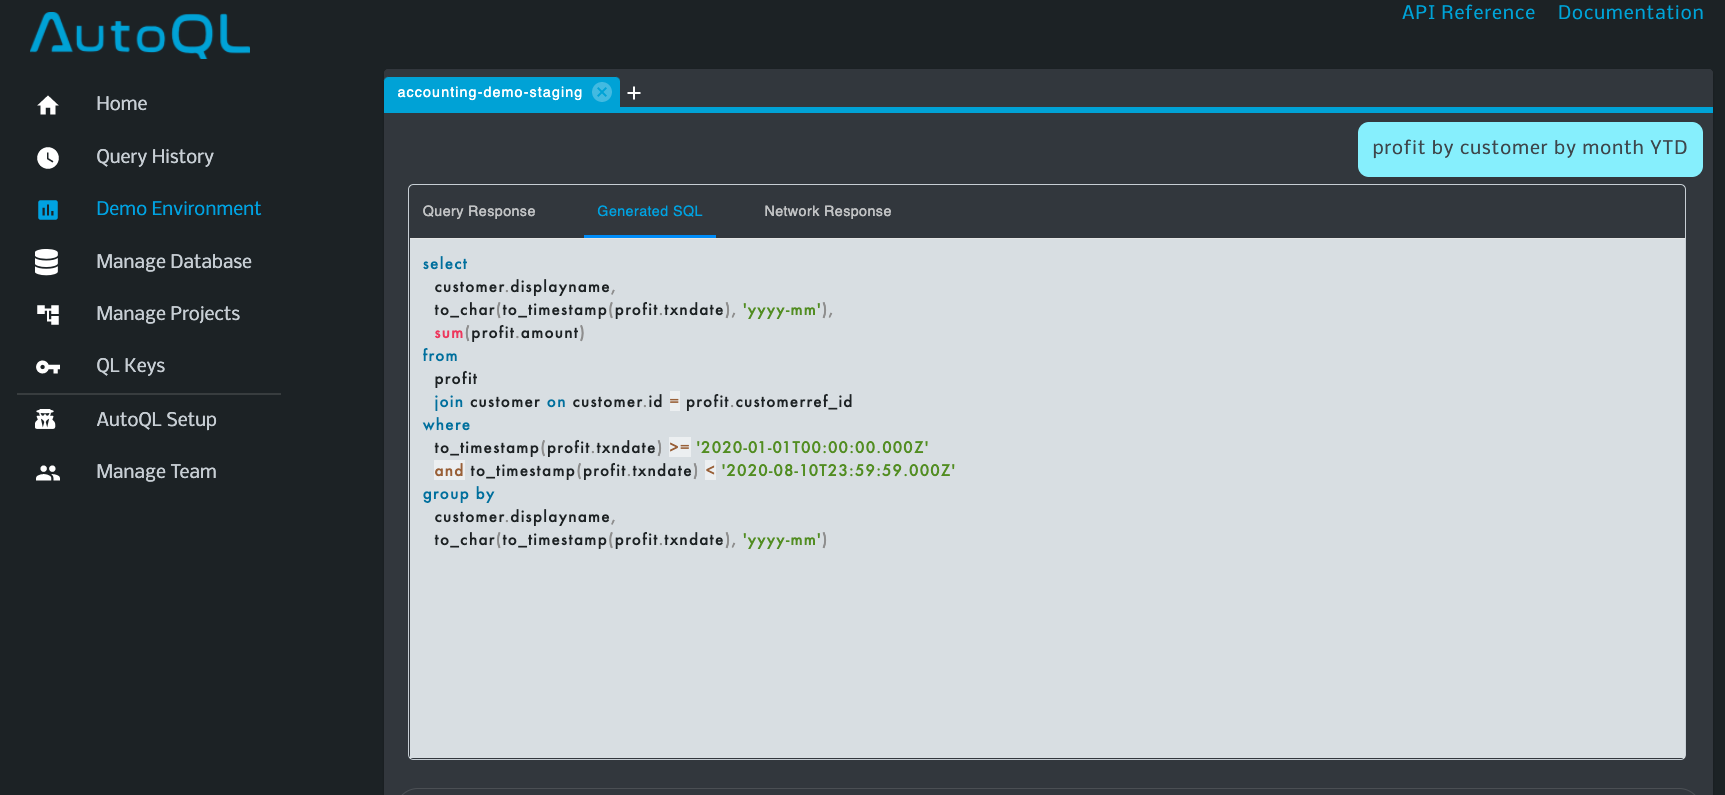
Natural Language Query, Generated SQL
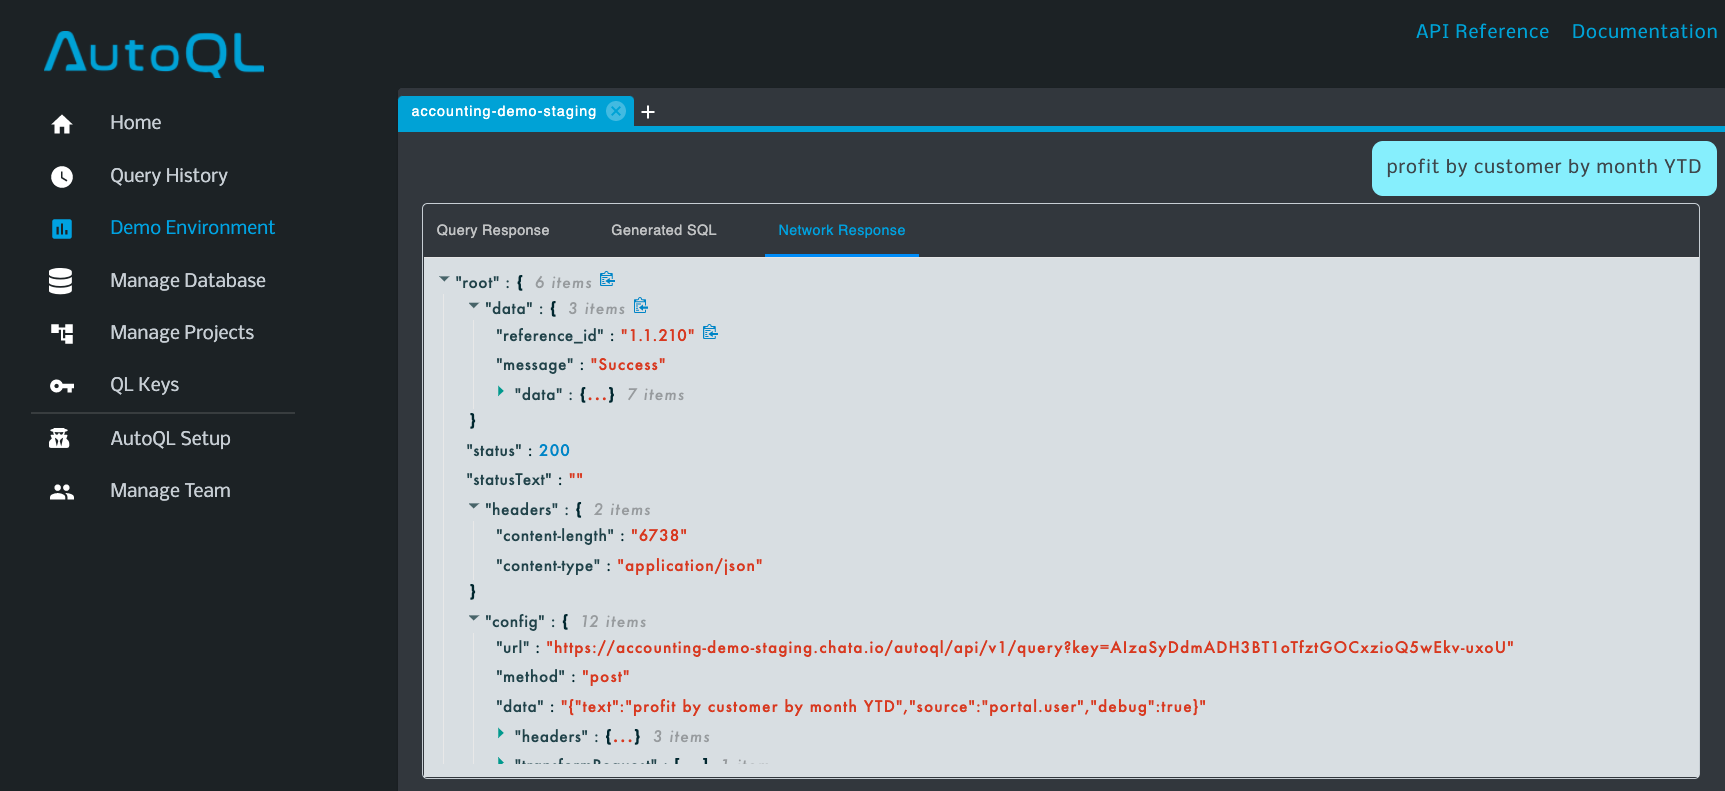
Natural Language Query, Network Response
Visualizations
Most Query Responses can be visualized in a variety of different data visualization types. Data visualization types are the graphical representations of data (returned as responses to NL queries) that communicate relationships among the represented data points to viewers or consumers of that data.
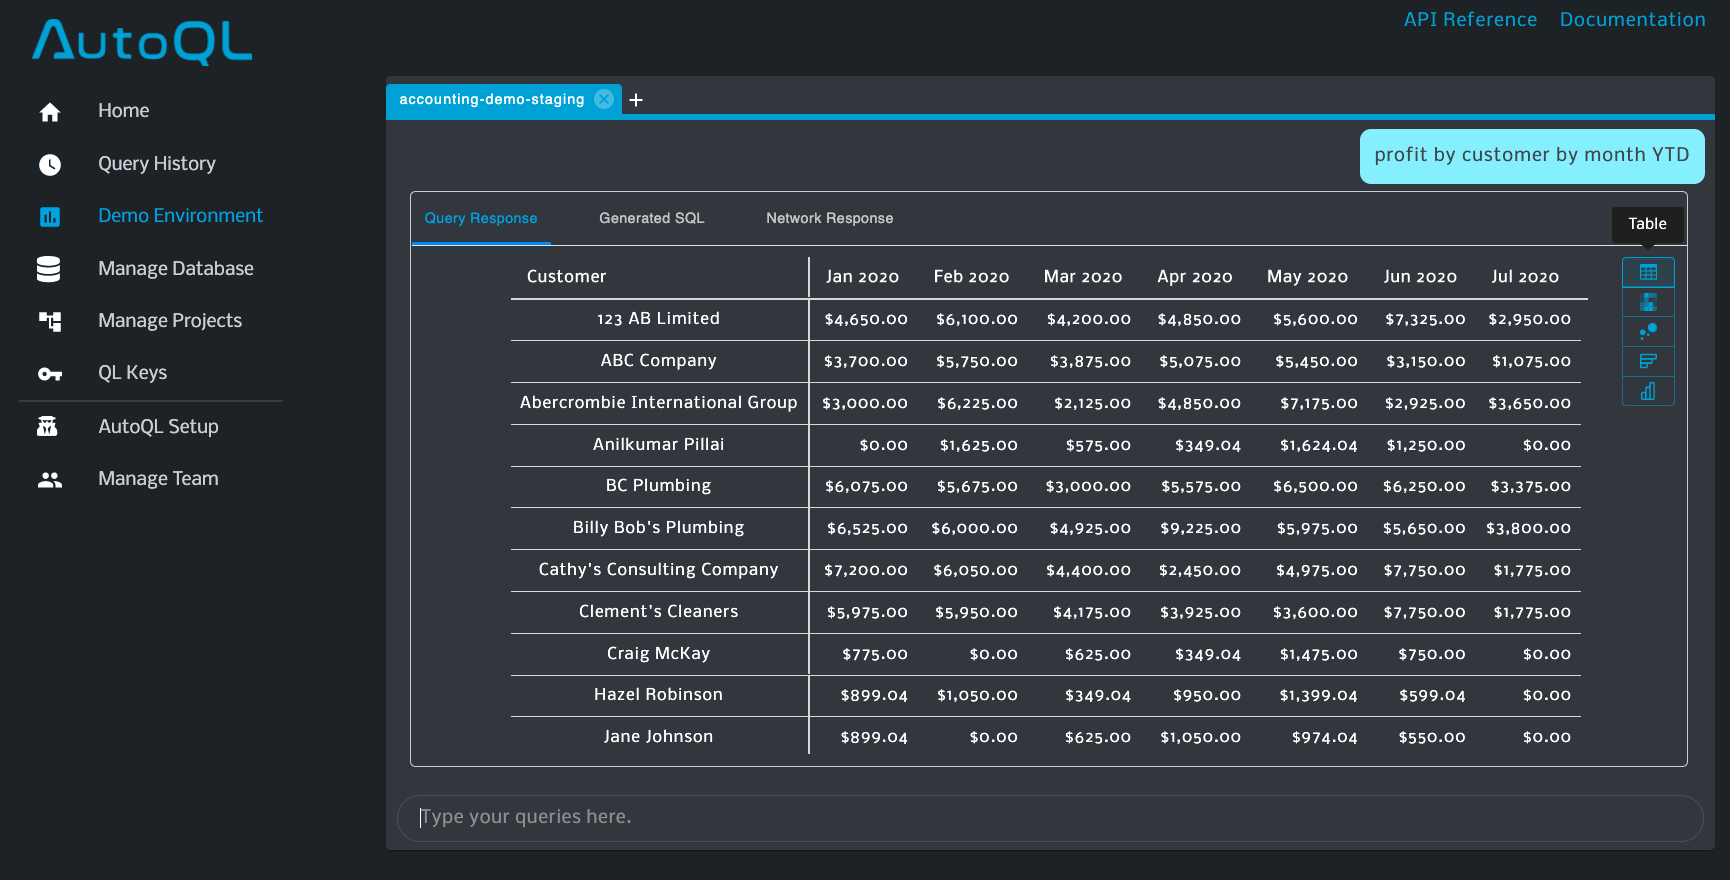
Data Response with variety of available Visualization Options (right-hand side)
To change the visualization (to a different chart or graph), hover your cursor over the right-hand side of the response window (as shown in the image above) and select your desired visualization type.
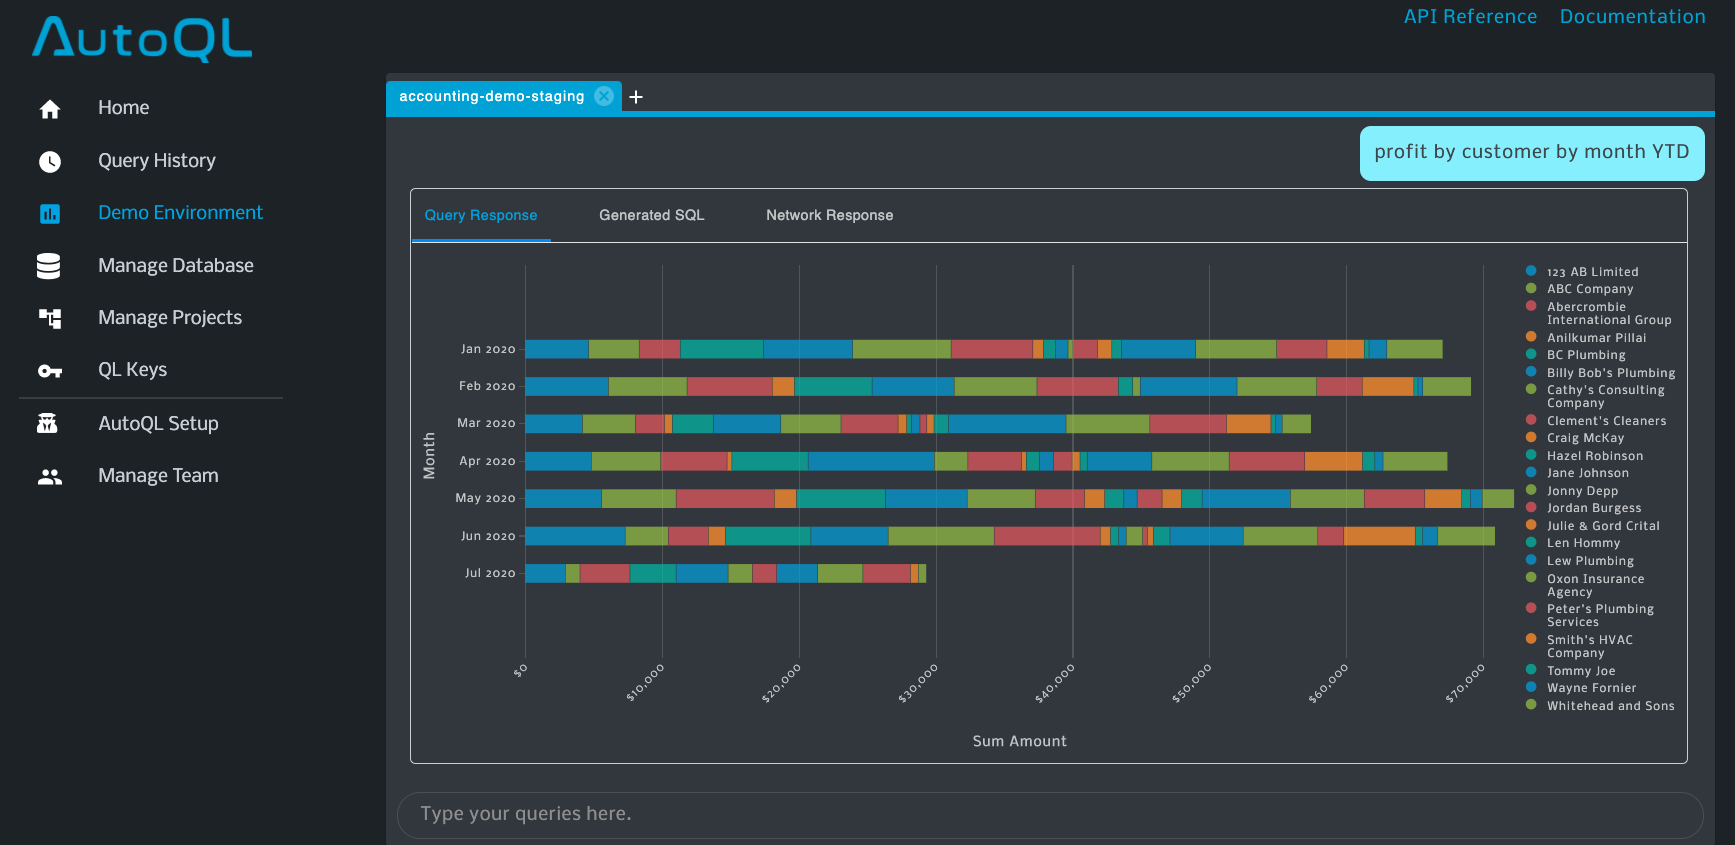
Natural Language Query: Profit by customer by month YTD
Visualization Type: Stacked Bar Chart
Looking for more information on supported Visualization Types?Check out our Data Messenger and Dashboards User Guides for more information about the various Visualization Types we support and what queries you can ask in order to receive different visualization options.
Response SuggestionsIf you enter a natural language query that does not return a successful data response, a list of similar or recommended queries will be returned to you. This feature helps ensure you're able have a successful querying experience, every time.
Updated 8 months ago
