Demo Sandbox
On this page:
- What is the Demo Sandbox?
- Accessing the Demo Sandbox
- Demo Projects
- Navigating the Demo Sandbox
- Demoing Data Messenger
- Demoing Dashboards
What is the Demo Sandbox?
The Demo Sandbox is an accessible demo environment where Integrators can try, test, and demo AutoQL.
The Demo Sandbox houses our front-end widgets, Data Messenger and Dashboards, allowing you to explore the robust functionality of AutoQL and showcase its capabilities in action.
Accessing the Demo Sandbox
To access the Demo Sandbox, sign in to the Integrator Portal and click on Demo Sandbox in the top right-hand corner of the screen (you'll find this next to API Reference and Documentation).
Once you've entered the Demo Sandbox, get started by selecting a Demo Project.
Demo Projects
What is a Demo Project?A Demo Project is a dataset that we've made available in the Demo Environment so you can test, experiment, and showcase use cases that are most relevant to you and your audience.
Below, we've provided a brief overview of each of the available Demo Projects.
Operational Data - Demo
The Operational Demo is a demo dataset made available to Integrators in our Demo Sandbox environment. This dataset contains data that may typically be found in an enterprise resource planning tool or a cloud accounting software system and is representative of a fictional Plumbing and Electric company.
Leverage the Operational Demo dataset to showcase AutoQL in action and experience what it’s like to query a database through natural language. Demoing with this dataset enables you to access and analyze data that represents relevant themes and topics that your business users are likely to be familiar with.
Stock Market Data - Demo
The Stock Market Demo is a demo dataset that contains Stock Market data from the S&P 500 Index and is made available to Integrators in our Demo Sandbox environment.
Note: The S&P 500 is a stock market index that measures the stock performance of 500 large companies listed on stock exchanges in the USA.
Demoing with this dataset enables you to access and analyze data that is continuously evolving or changing in the US stock market. This allows you to showcase how any user could use AutoQL to keep an active pulse on the stock market data that they are interested in tracking and analyzing.
For more information and tips on demoing with each Demo Dataset, check out our Demo Sandbox Tips in the Resources section of the docs.
Navigating the Demo Sandbox
Begin by selecting a Project.
Once selected, you'll see two icons appear on the right-hand side of your screen:
- Data Messenger (chat/speech bubbles)
- Dashboard Editor (pencil icon)
Data Messenger is a customizable conversational user interface (CUI) that facilitates database querying and analysis through natural language.
Dashboards provide users at-a-glance overviews of key performance indicators that are relevant to their unique objectives and business operations. Dashboards offer user-friendly reporting functionality that showcases data in real time, enables drill downs on-the-fly (with no additional setup for Integrators), and are completely customizable for users of all types through natural language queries and dynamic visualizations.
Click on either Data Messenger or Dashboards to continue with your demoing experience.
Demoing Data Messenger
Access Data Messenger in the Demo Sandbox by clicking on the chat/speech bubbles icon. A chat-like window will open, like this:
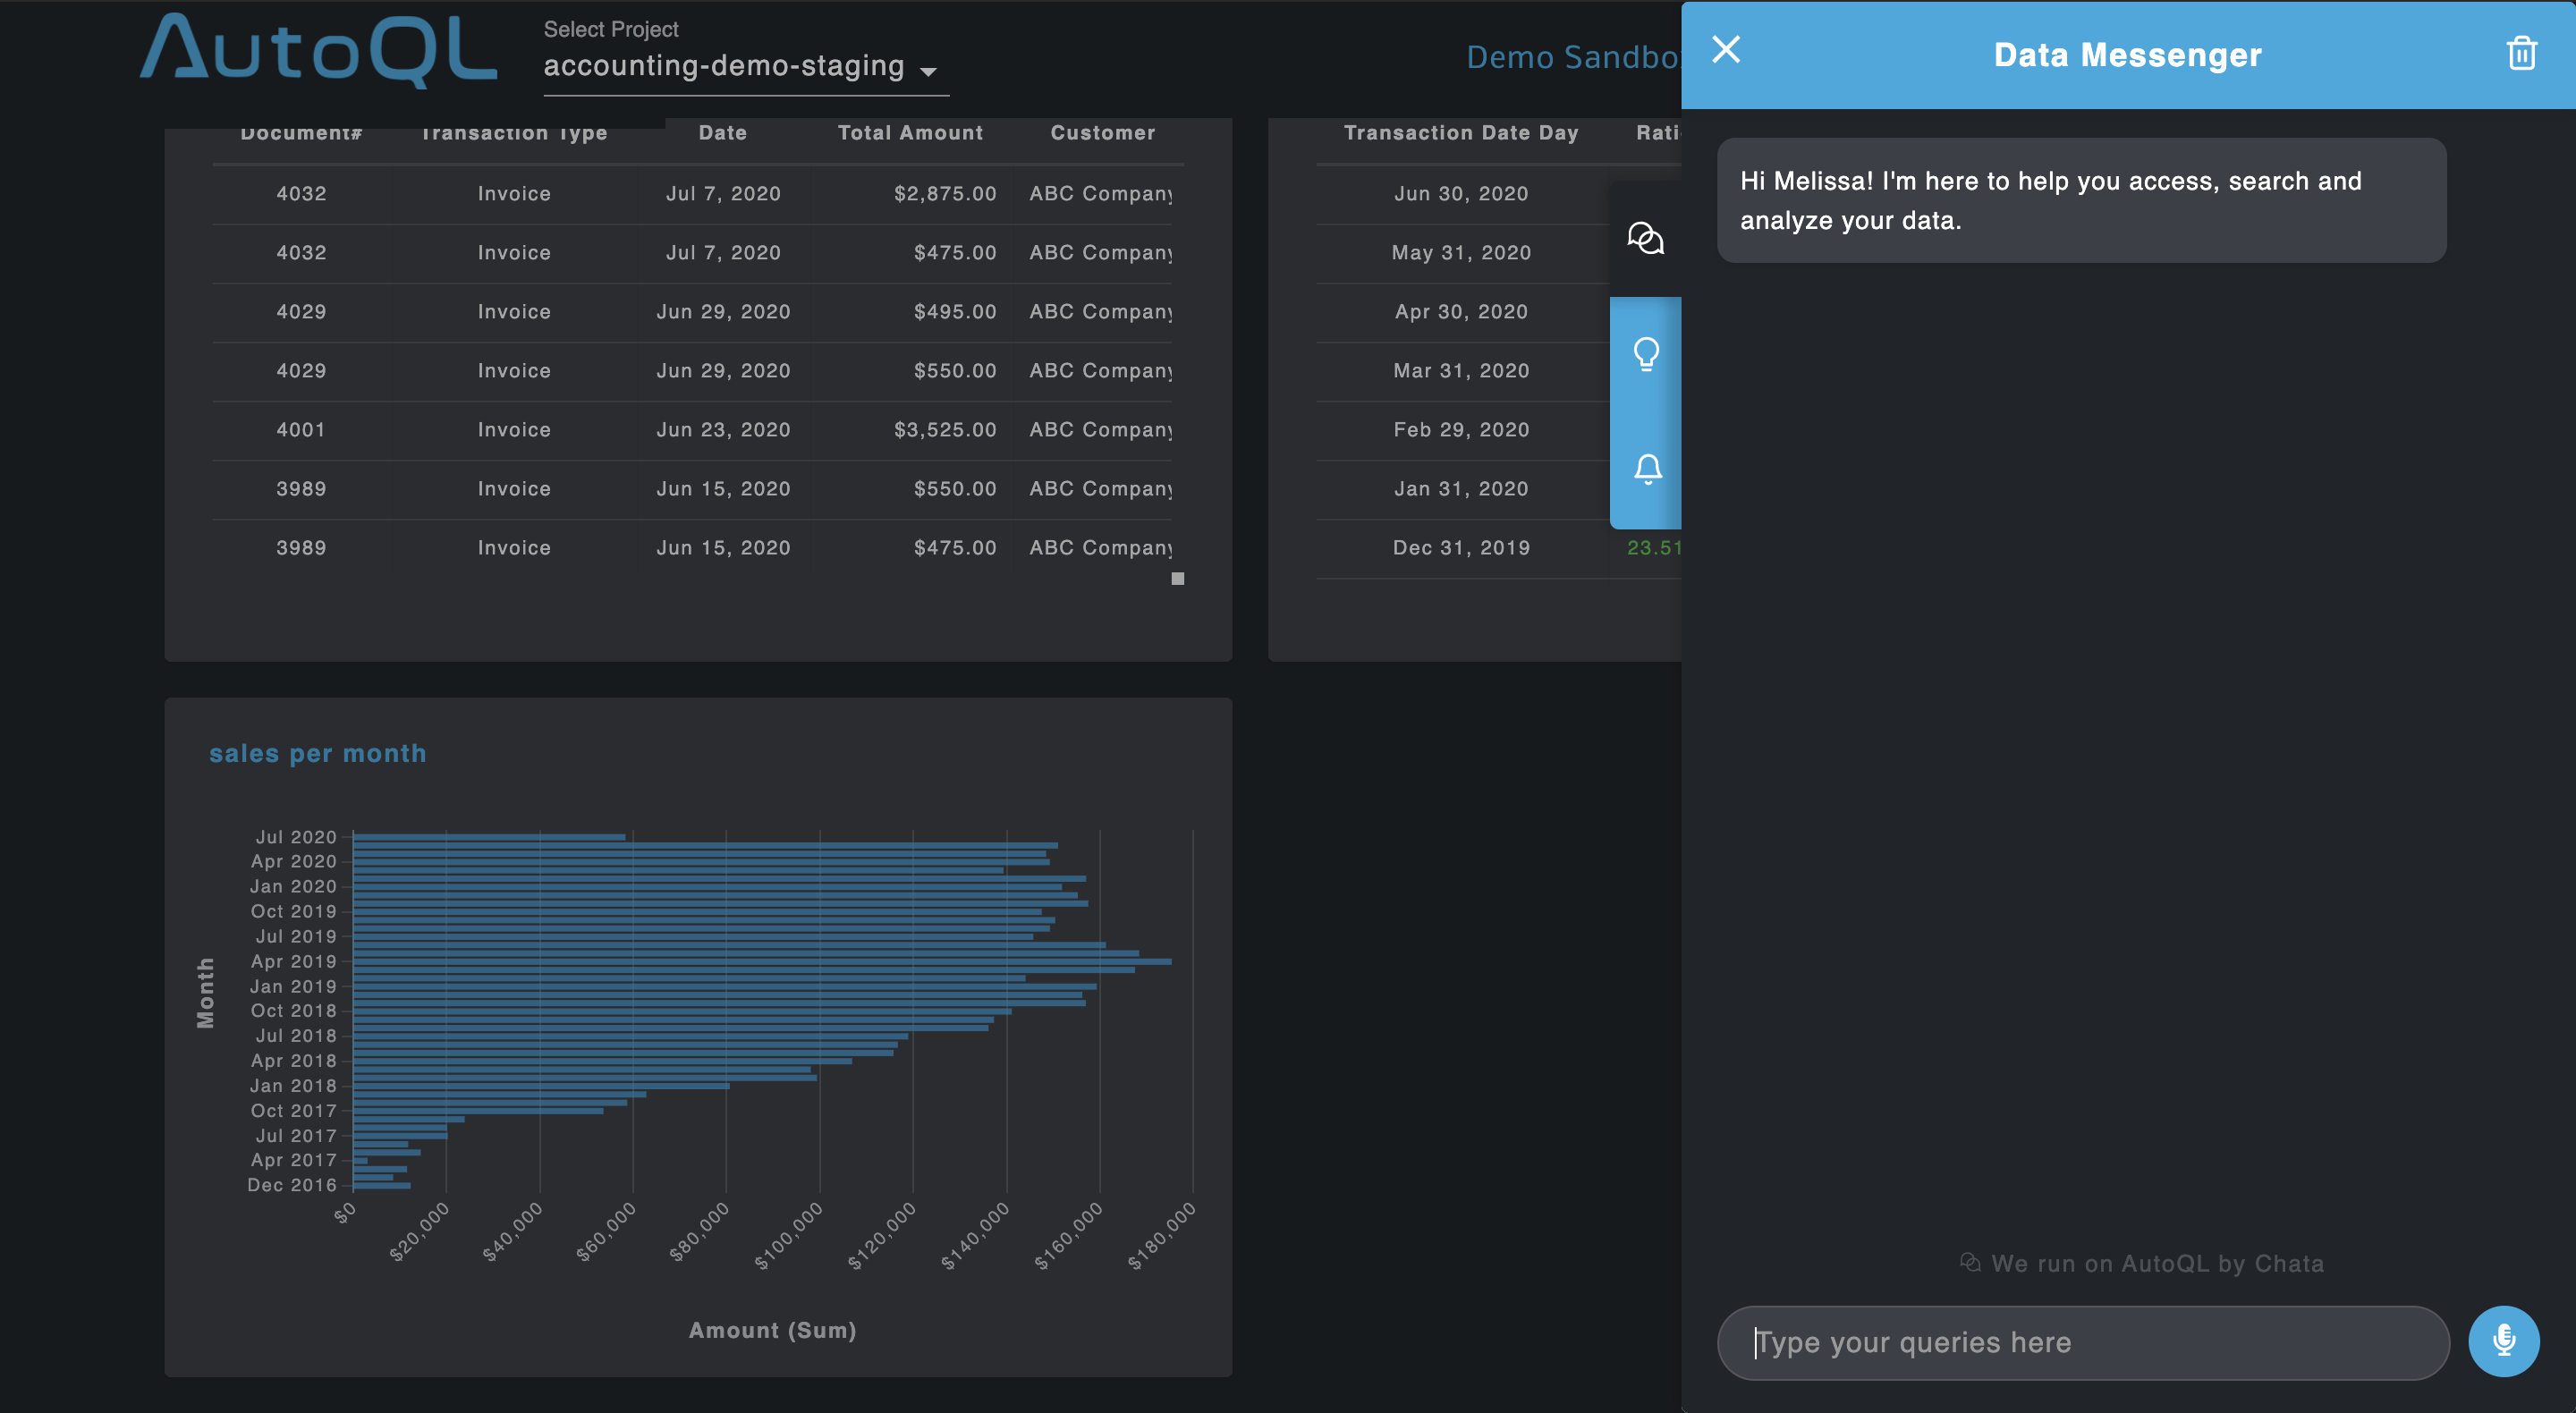
Check out our 3-Minute Demo of Data Messenger below, or keep reading to learn more.
Here's an overview of everything you need to know to successfully experiment and demo with Data Messenger:
How to Query with Data Messenger
To receive an answer to your data-related question in Data Messenger, simply type your question in your own words in the search field and hit Enter. The data you have requested will be returned in just seconds. Once you've received your response, you can easily change the visualization, click to drill down into a particular data point, export your data response, or ask another query.
What queries or questions can I ask in Data Messenger?You can ask a wide range of simple-to-complex queries in Data Messenger.
Leverage our helpful onboarding features, "Query Quick Start" or "Explore Queries", if you're unsure about where to start.
If you already have a topic (sales, expenses, profits, etc.) in mind or a query you're interested in, simply type it into Data Messenger to receive a response.
Navigating the Tabs
There are multiple tabs that appear on the left-hand side of the Data Messenger interface. The first tab is Data Messenger (default/home). The second tab is Explore Queries. The third is Notifications.
To navigate between tabs, simply click between them:
Data Messenger (Default/Home)
- Data Messenger is the default view or "home" interface, where you can quickly and easily enter natural language (NL) queries to access data from your database. In this view, simply ask questions that pertain to the data you wish to explore or see, and receive a response within seconds.
Explore Queries
- The Explore Queries tab is designed to facilitate seamless, self-service user onboarding by providing an easy-to-navigate, searchable catalogue of natural language queries. Similar to a Google Search, simply type in a topic or theme you are interested in querying and automatically receive a list of every NL query you can ask that contains your input. To receive a narrower list of NL queries, enter multiple terms in the Explore Queries search bar. This feature empowers users to get started quickly, explore the wide range of NL queries that can be can asked, and experience success right away.
Expanding your View
There may be instances where you want to stretch the Data Messenger window in order to expand your field of view for a particular visualization or to see more columns within a table.
To expand the Data Messenger interface, simply click on the edge of the widget, and drag and pull the edge in the direction of the opposite side of the interface. To collapse or shrink the field of view, simply click and drag the edge back in the other direction.
For more information regarding all the core features and capabilities of Data Messenger, check out our Data Messenger User Guide.
Demoing Dashboards
With Dashboards powered by AutoQL, it’s incredibly simple to create dynamic, at-a-glance overviews that display the metrics that matter most to you and your users.
To demo Dashboards, select a Project and begin editing by clicking the edit button (pencil icon) on the right-hand side.
Check out our 3-Minute Demo of Dashboards below, or keep reading to learn more.
Adding Dashboard Tiles
What is the Dashboard Editor / Edit Mode?In Edit Mode, you can easily add new Dashboard Tiles, modify the size and position of Tiles, adjust the underlying natural language queries in each Tile, change the Title/Description of individual Tiles, or toggle between different visualization options to display the data responses to your liking.
Once you've entered Edit Mode, you can begin building your own Dashboards from scratch using natural language.
Each Dashboard is composed of a series of Dashboard Tiles. Each Dashboard Tile is underlaid by a natural language query: a data-related question that is asked in your typical everyday language.
What is a Dashboard Tile?Dashboards contain a series of Tiles. Think of Dashboard Tiles like individual puzzle pieces, each contributing to the "big picture", which is the Dashboard itself.
Each Dashboard Tile houses a natural language query and a data response in the form of a visualization (a chart of graph). The size and position/location of each Tile can be easily modified through simple drag and drop commands.
Click on the "+" symbol to add your first Dashboard Tile.
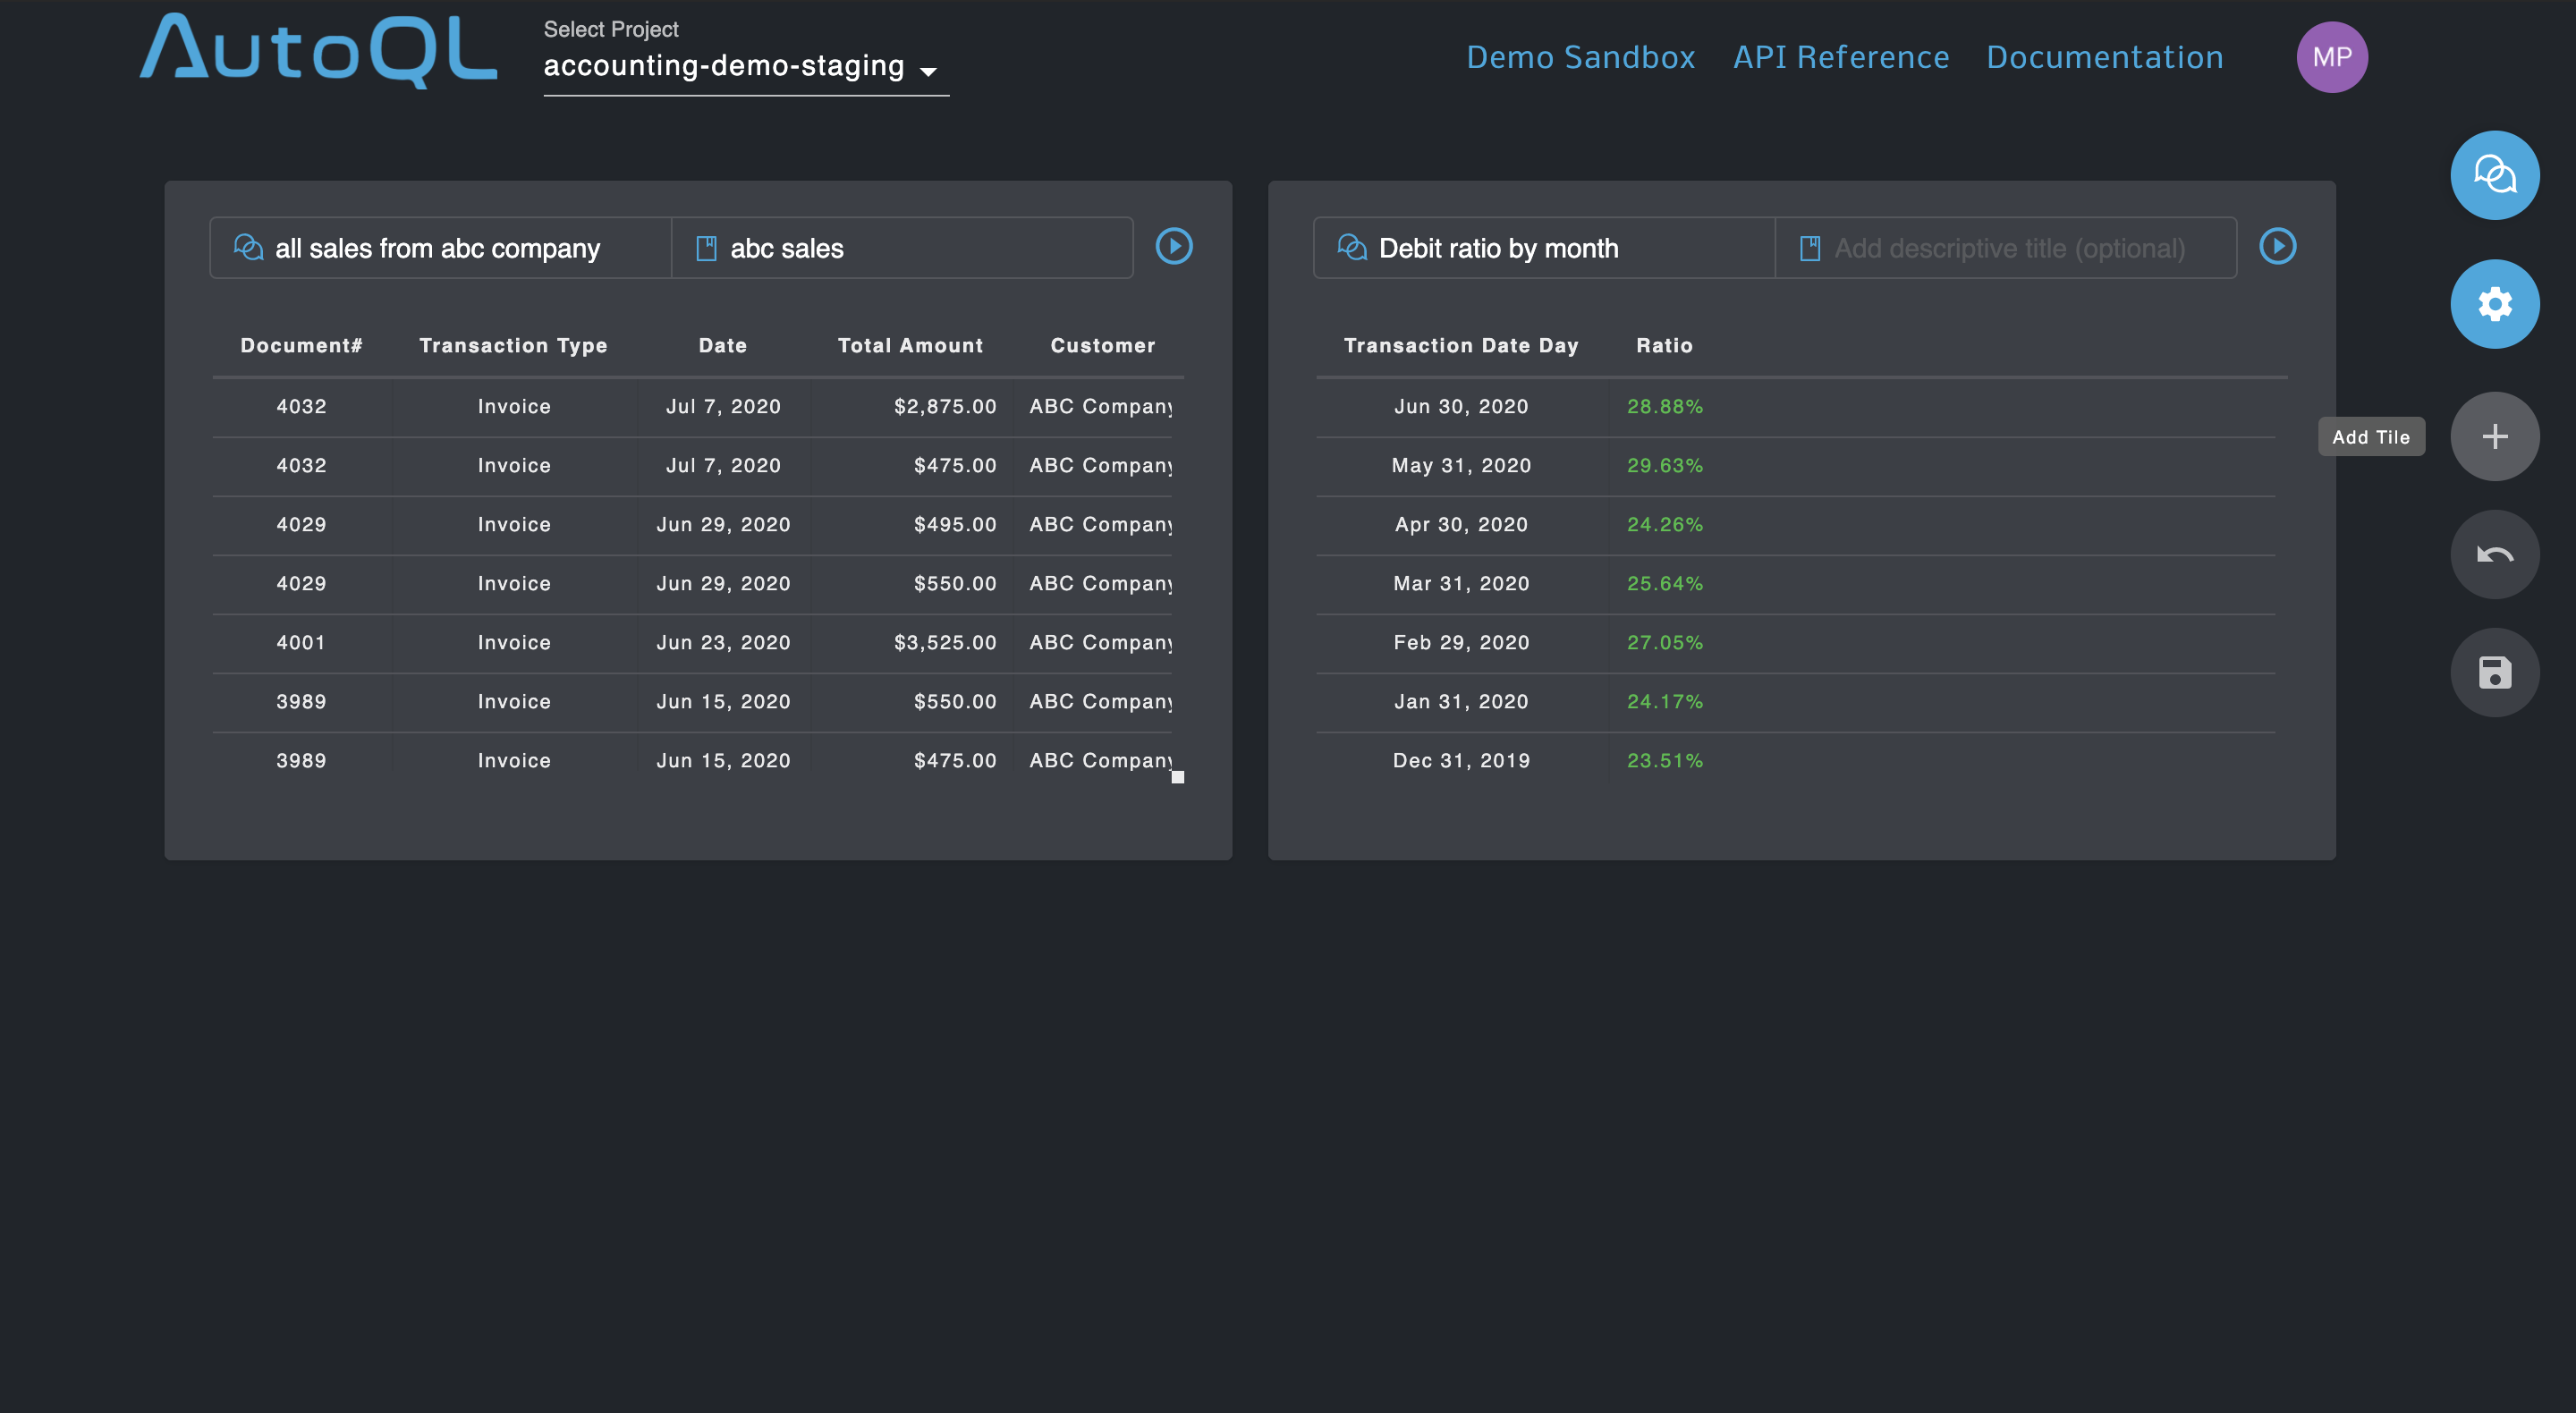
A new Dashboard Tile will appear. This is where you will enter your natural language query.
All Dashboard Tiles are underlaid by natural language queriesEach Dashboard Tile is underlaid by a natural language query, or more simply put, a data-related question that you ask in your own words. This means you don’t need to have any prior database querying skills to set up a Dashboard, you can just ask questions and get instant results!
Once you've typed your data-related question into the query input bar in your new Dashboard Tile, hit Enter or the "Play" button.
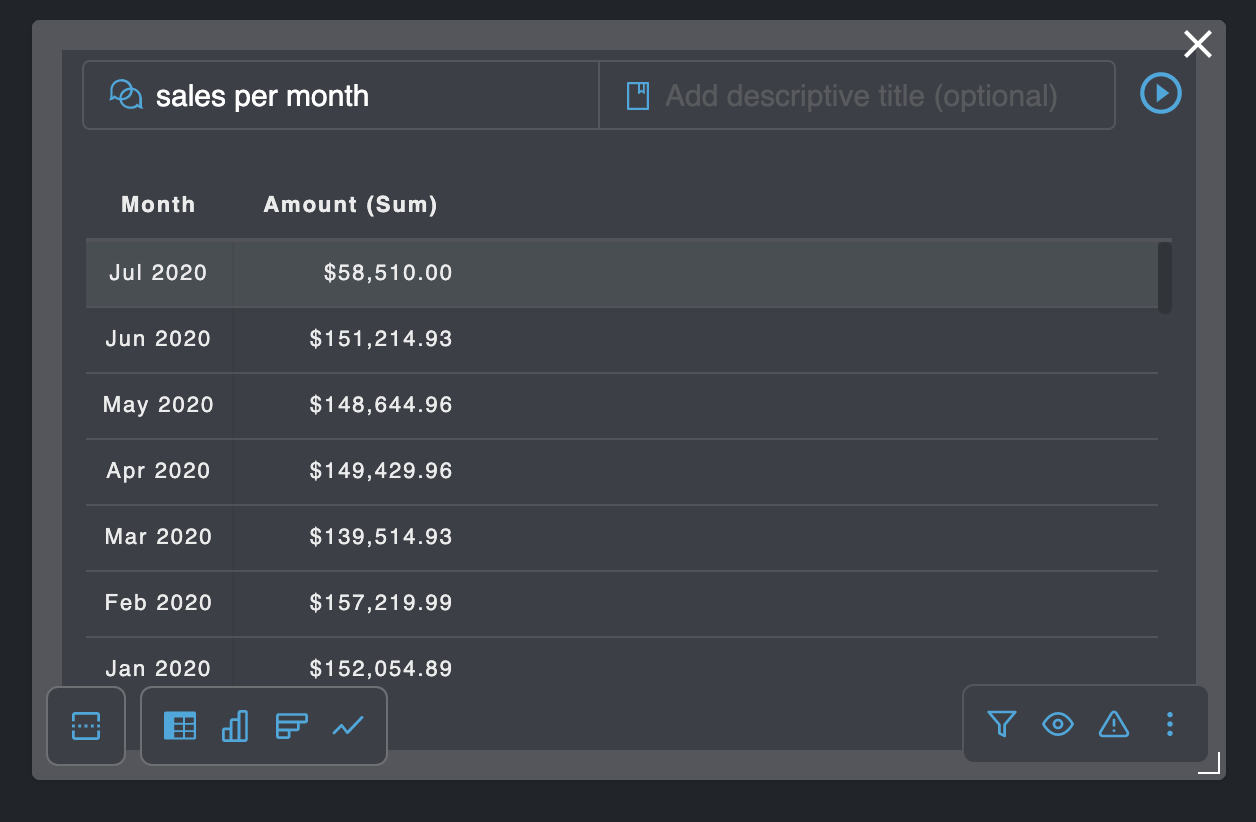
You'll see that a data response gets returned to you right away. You can easily manipulate the visualization type to showcase that data response in a visualization (a chart, graph or table) that is most impactful for your data storytelling and data consumption purposes.
Data visualizationsData visualizations are the graphical representations of data (returned as responses to NL queries) that communicate relationships among the represented data points to viewers or consumers of that data.
Check out our Dashboards User Guide to learn more about the variety of charts and graphs that are available to you.
If you wish, you can also add a descriptive title to your Tile. Adding a descriptive title allows you to tell your data story effectively and consume information at-a-glance.
Note: Adding a descriptive title is optional. If you choose to leave this field blank, the Tile will default to showcase the natural language query input as the title for that Tile once you navigate out of Edit Mode.
Adjusting Size and Position of Tiles
The size and position of each Tile can be easily modified through simple drag and drop commands.
To resize a Tile, click and drag from the bottom-right corner of the tile to the width and height you prefer.
To move a Tile to a different position on your Dashboard, simply hover over the outer edges of the Tile. You will notice that your mouse changes to a multidirectional arrow. Now, simply click and hold the tile to grab it with your mouse and drag it to your desired location.
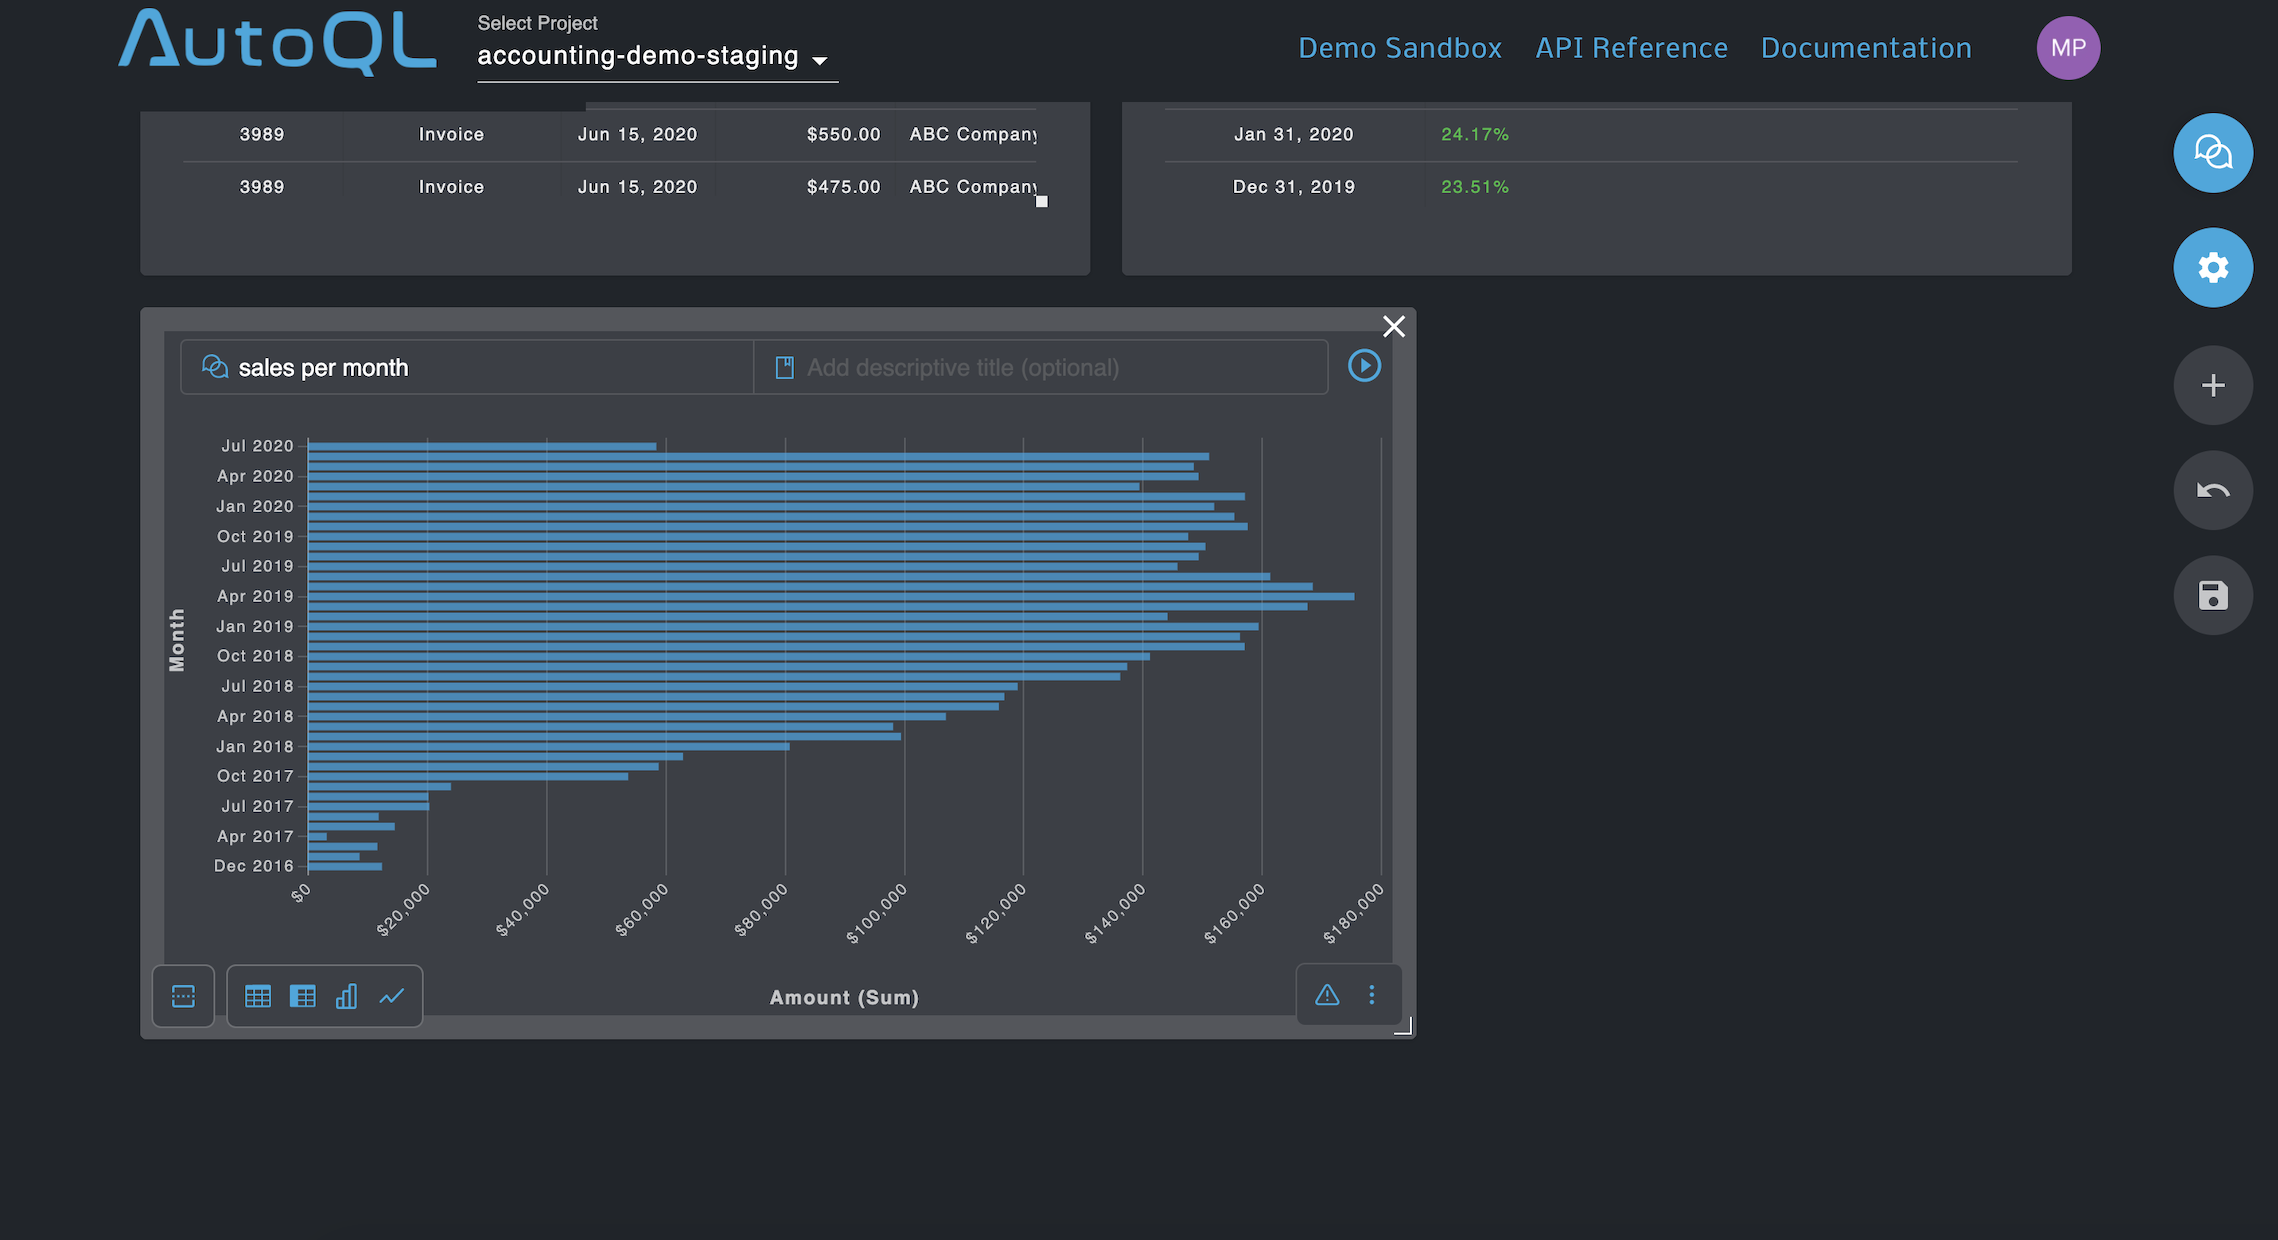
Saving Your Dashboard
Once you've set up several Tiles to complete your Dashboard, be sure to click "Save Current Dashboard". This will save all of your current Tiles and run the Dashboard for you.
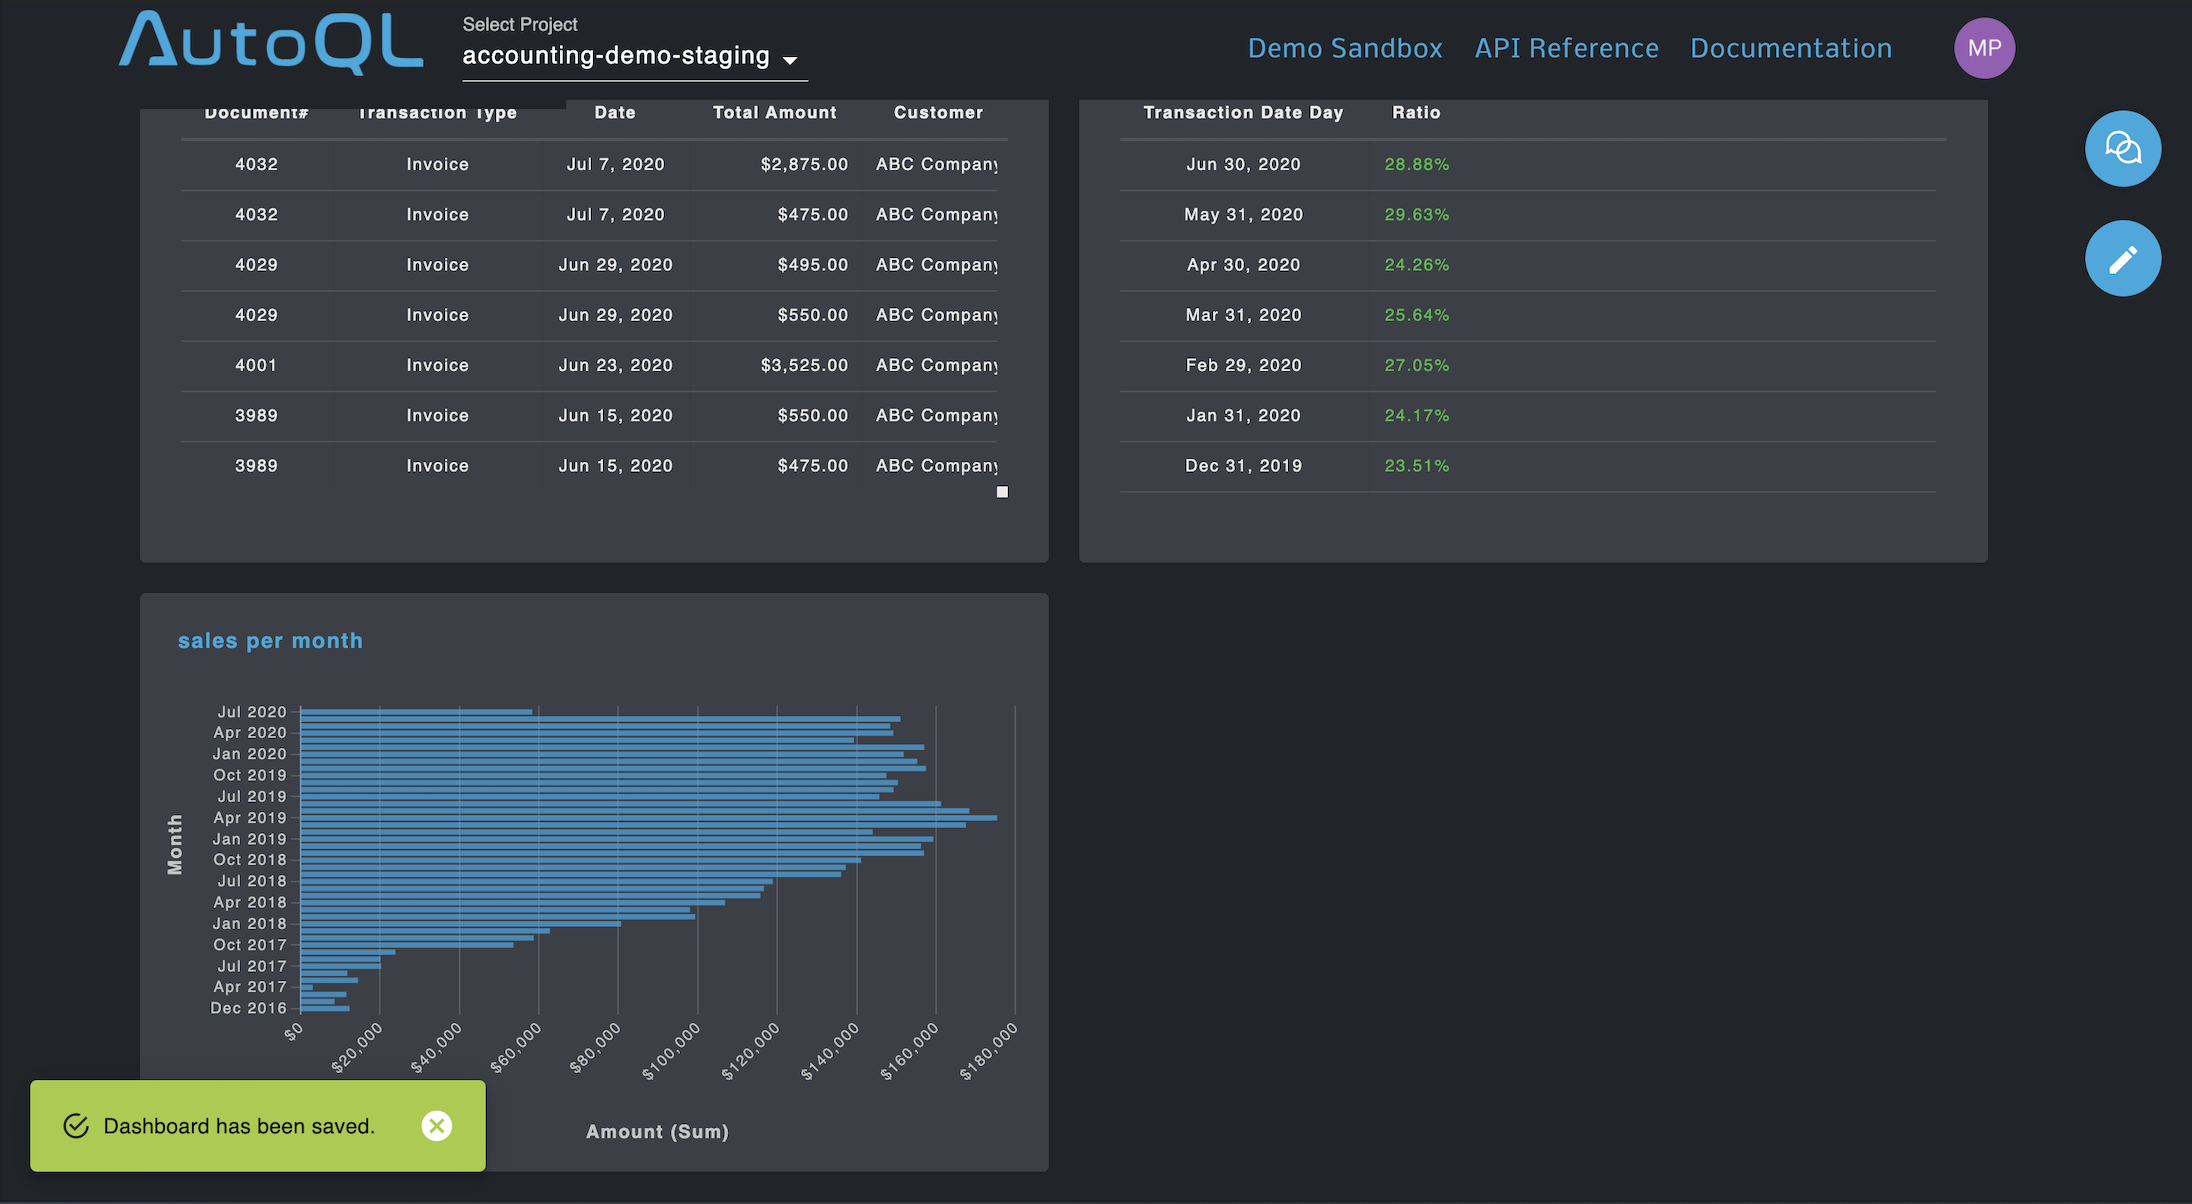
For more information regarding all the core features and capabilities of Dashboards, check out our Dashboards User Guide.
Looking for more tips on how to demo AutoQL successfully?For tips on how to ask great queries, check out our Data Messenger and Dashboards User Guides.
Updated 5 months ago
