Data Alerts User Guide
On this page:
- Data Alerts Overview
- Creating a Custom Data Alert
- Pre-Built Project Data Alerts
- Receiving Alerts
- Managing Alerts
Overview
Data Alerts notify users whenever the result of a query is under/over or is equal to a certain amount, or under/over or equal to the result of another query.
Users can view Data Alerts when logged into the Webapp by clicking on “Data Alerts” in the upper-left corner of the screen.
There are two types of Data Alerts: Project and Custom.
- Project Data Alerts are built in the Portal and are viewable to all users.
- Custom Data Alerts are built from queries made in Data Messenger and are only viewable to the user who made it.
Creating a Custom Data Alert
To create a custom Data Alert:
- Enter a query in Data Messenger that you’d like to monitor
- Hover over the query result. In the right toolbar that pops up, click the vertical three dots (More options)
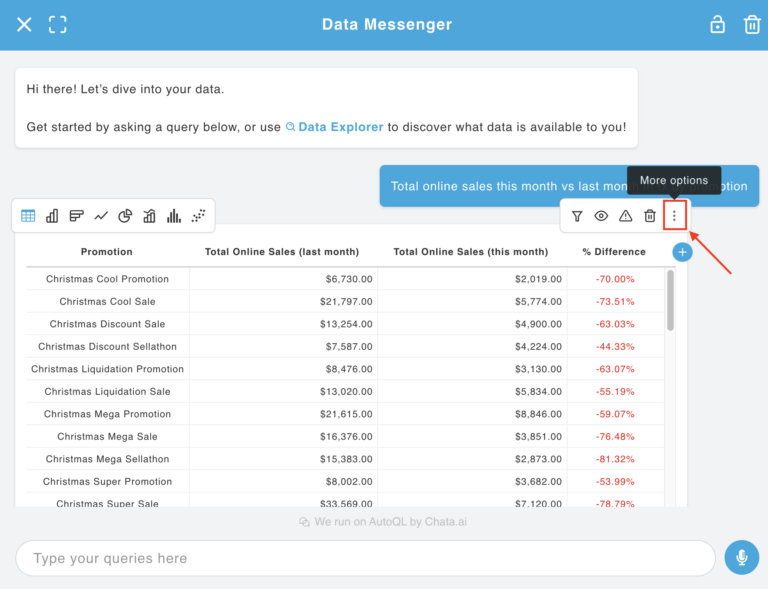
- Click “Create a Data Alert...”
- There are 4 steps to finalize the Data Alert:
- Step 1 - Set Up Conditions: Choose the metrics to be alerted on. These can include when the condition is greater than/less than/equal to for “this number” or “the result of this query”
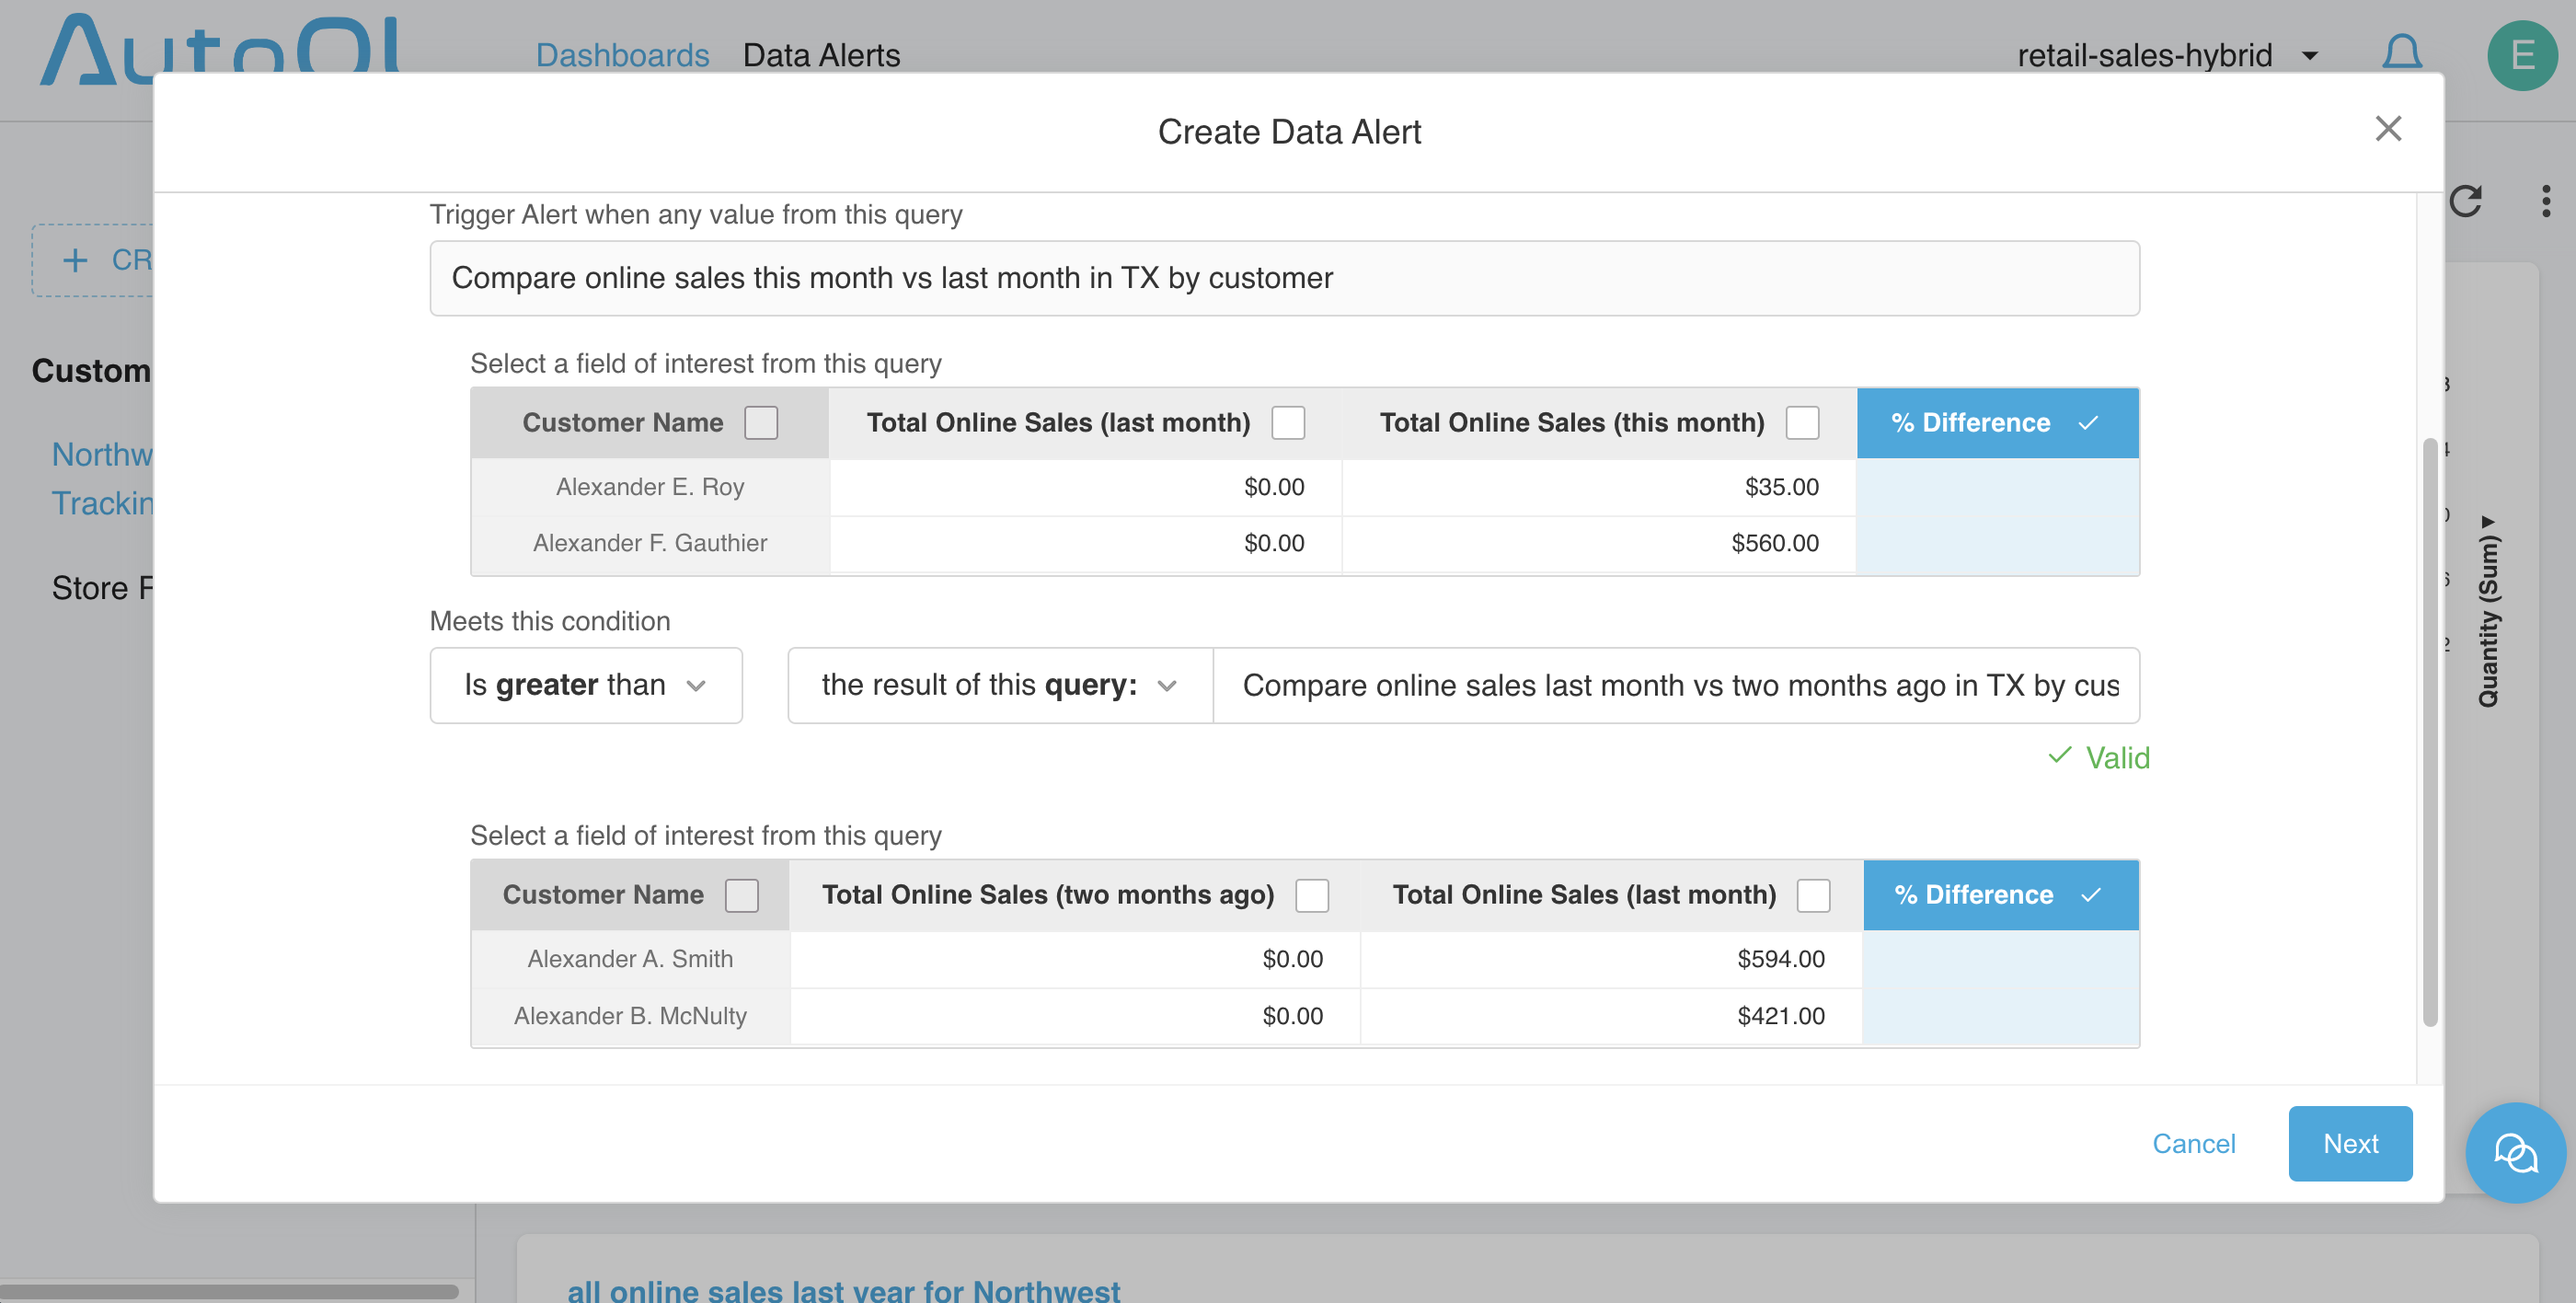
-
Step 2 - Configure Timing: Choose the day of the week and time to be alerted if the conditions are met
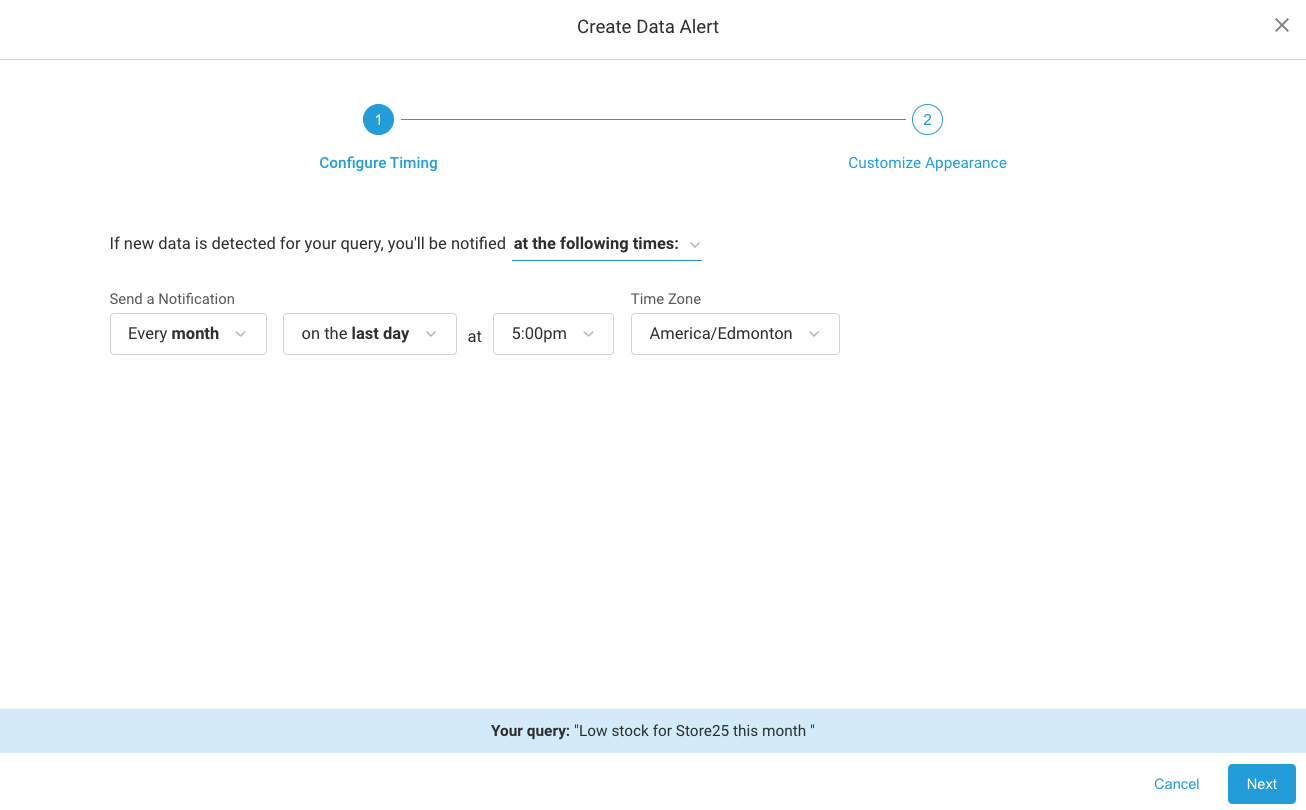
-
Step 3 - Customize Appearance: Give your Data Alert a title and a message (optional)
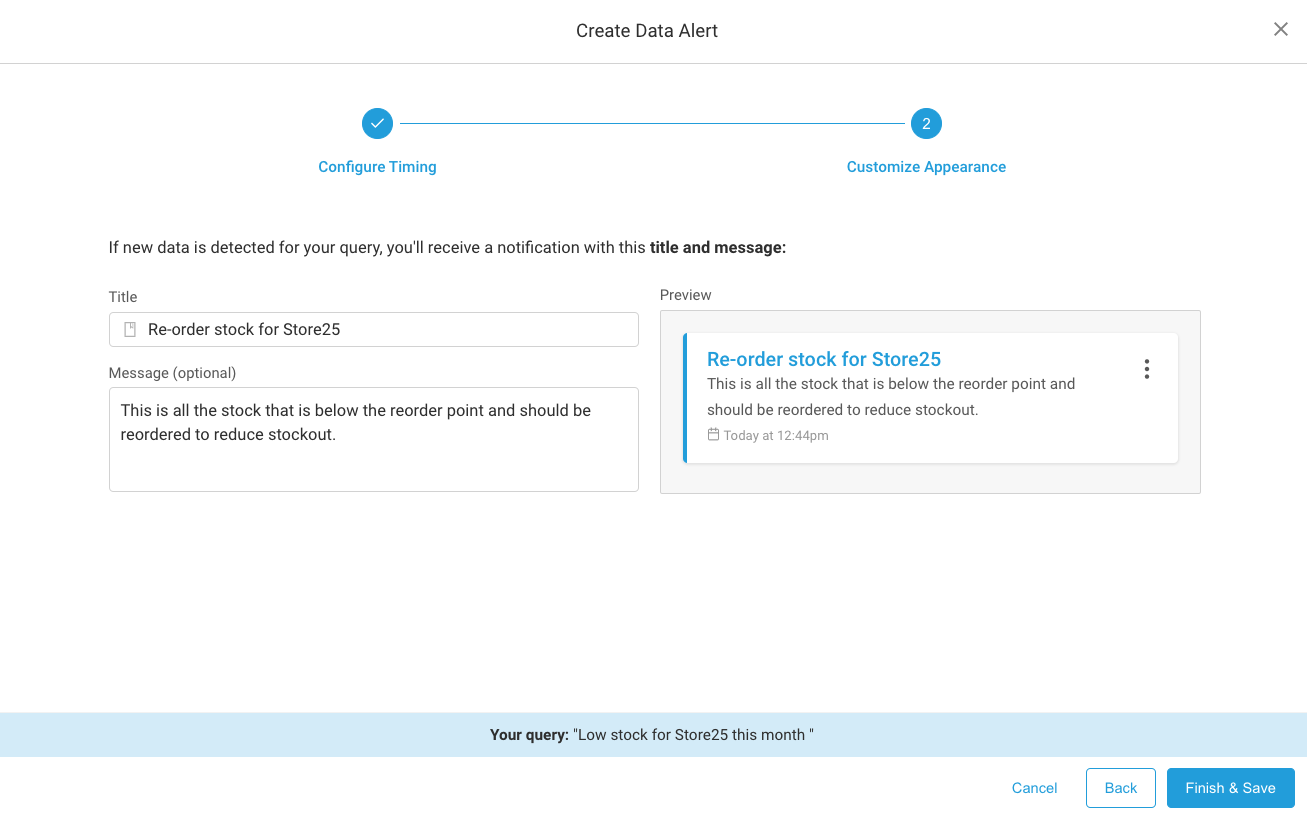
-
Step 4 - Hit “Finish & Save” to finalize your Alert
Note: you’ll receive a confirmation message in the bottom left corner of the screen
- Change the status of the Data Alert as desired. The Data Alert default status is “Active”. To turn the Alert off, click the slider to “Inactive”.
Pre-Built Project Data Alerts
Project Data Alerts have been pre-built and are available to all users. They can be added to or removed by users with Portal admin rights.
Webapp users can change the status of these Data Alerts to Active if they wish to be alerted when the conditions of the alert are met.
Receiving Alerts
When the monitored data reaches the thresholds that you’ve set, you’ll receive an alert in your notification center (see instructions below on how to access it) depending on which notification preference you selected for the alert (every time, daily, weekly, or monthly).
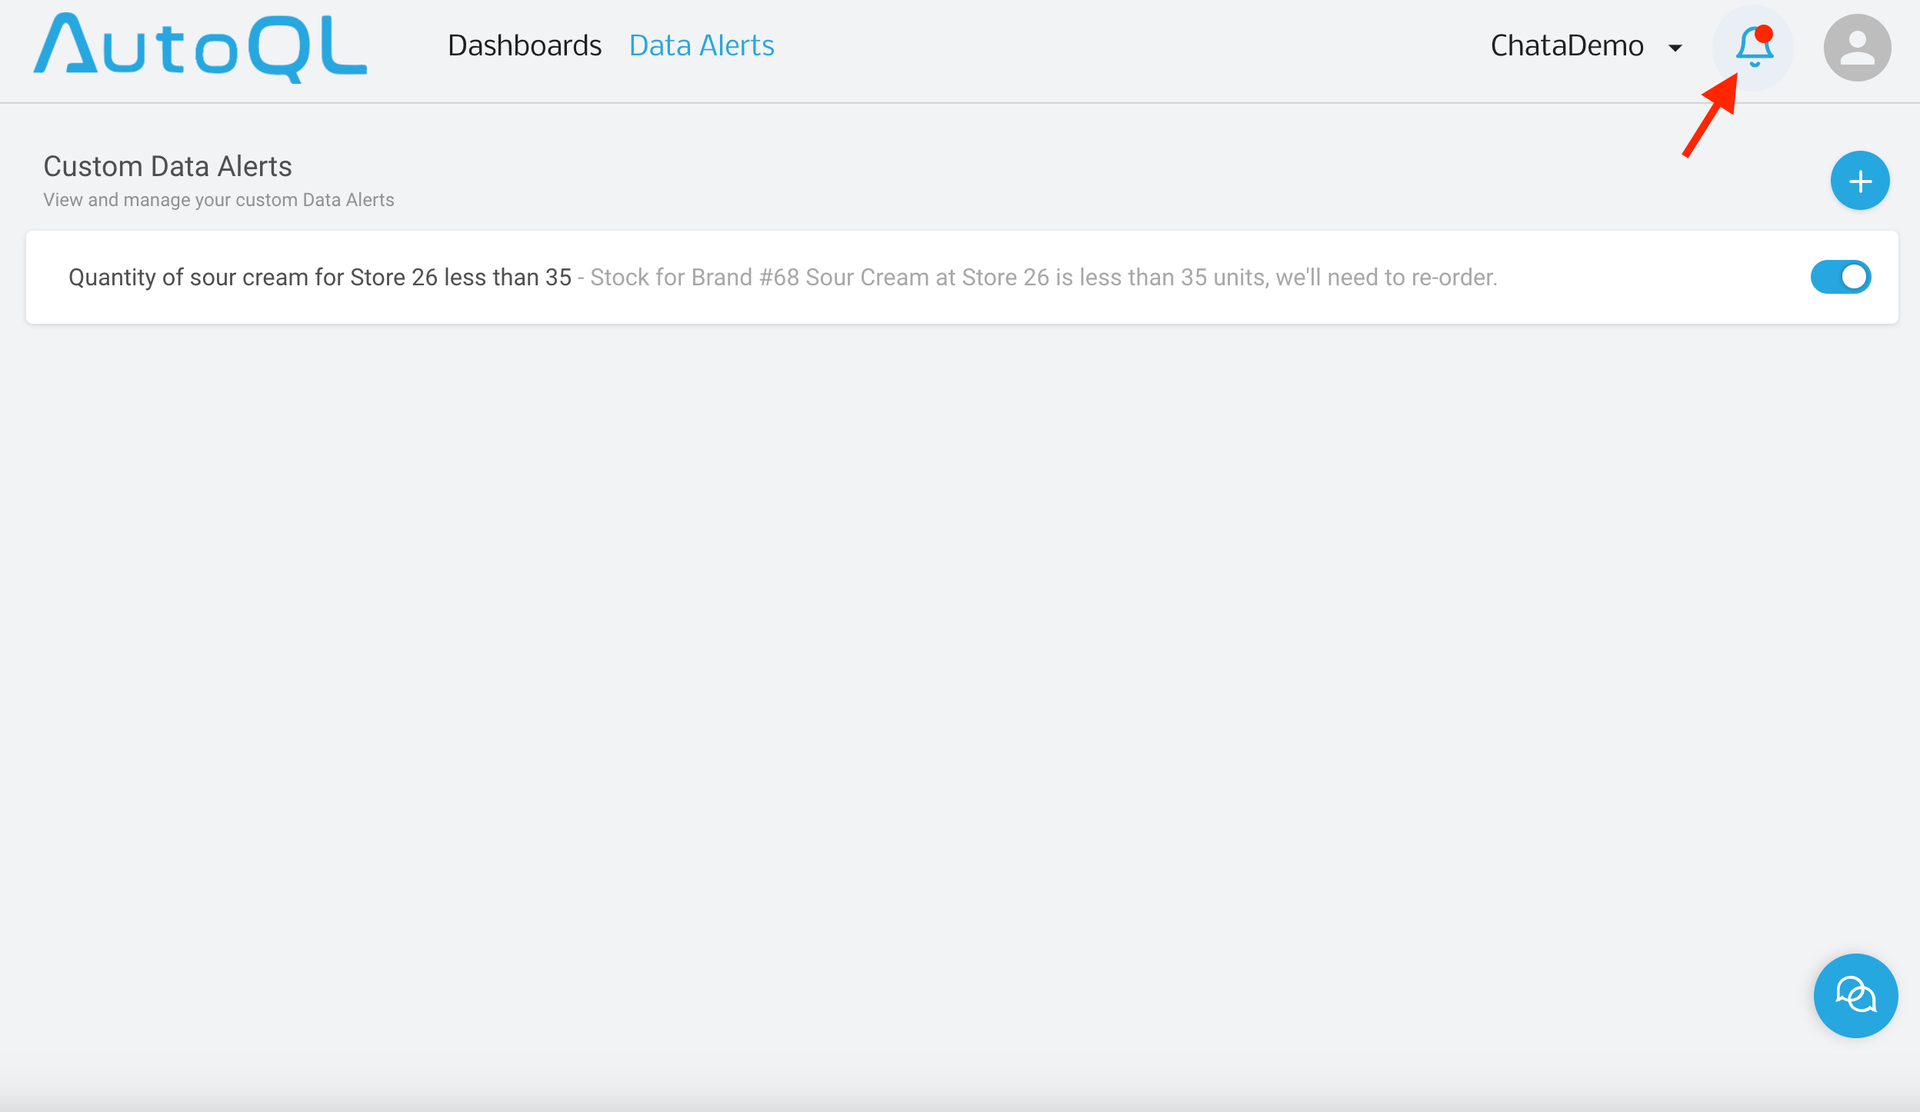
-
Click on the Bell icon in the top right corner to view your notification center and all the Alerts that met their conditions.
-
Click on each Notification Tile to review the Alert query and result.
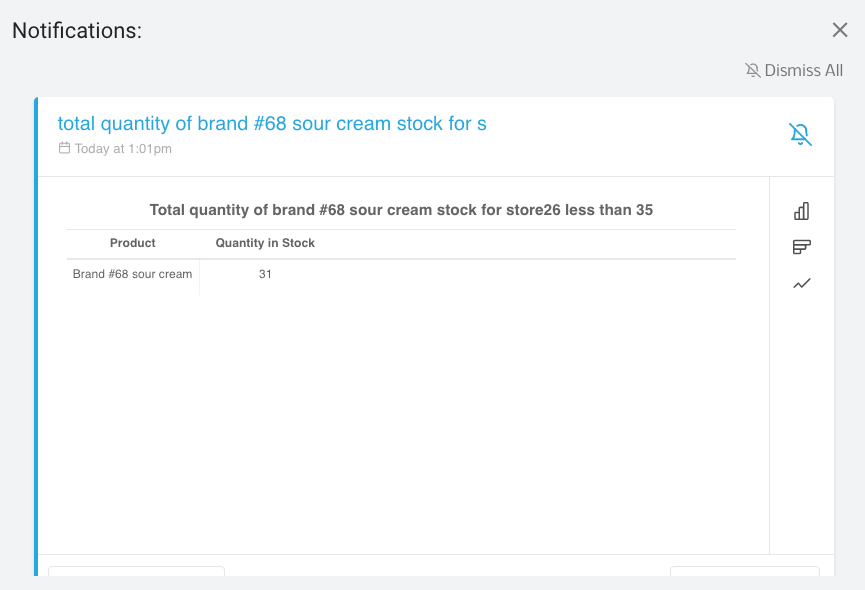
-
Select the visualization option you wish to display your data in (on the left side of the data response you’ll see a list of visualization options available to you).
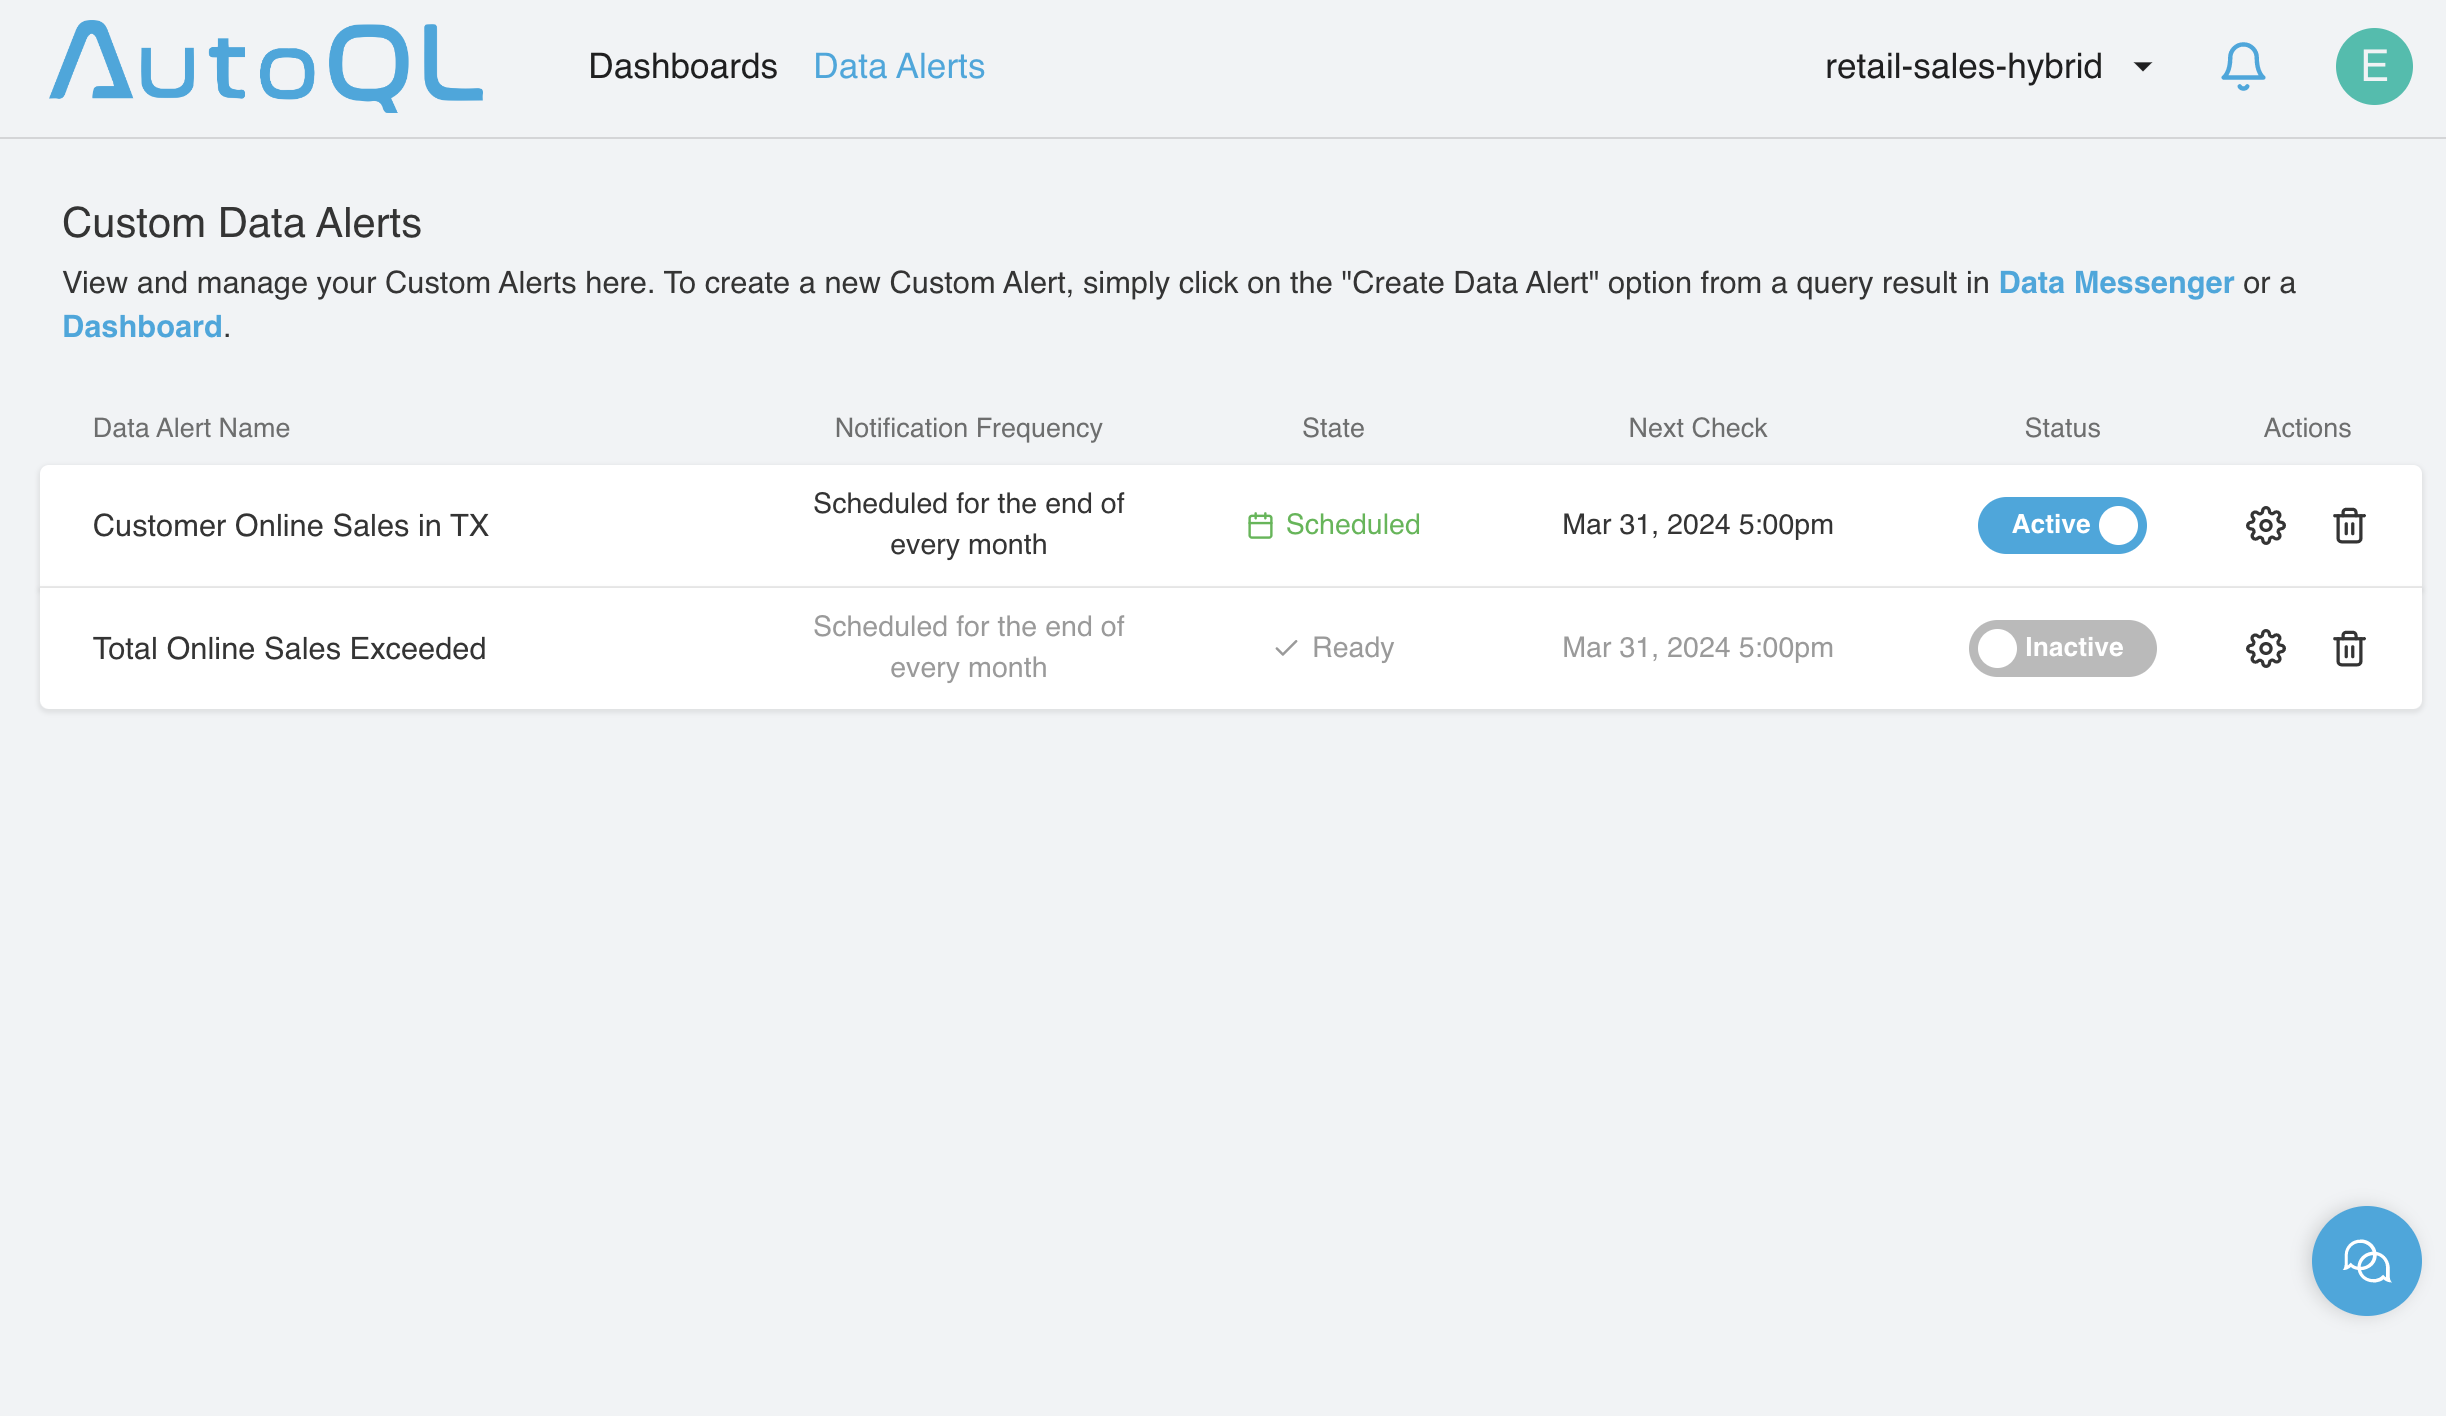
Managing Alerts
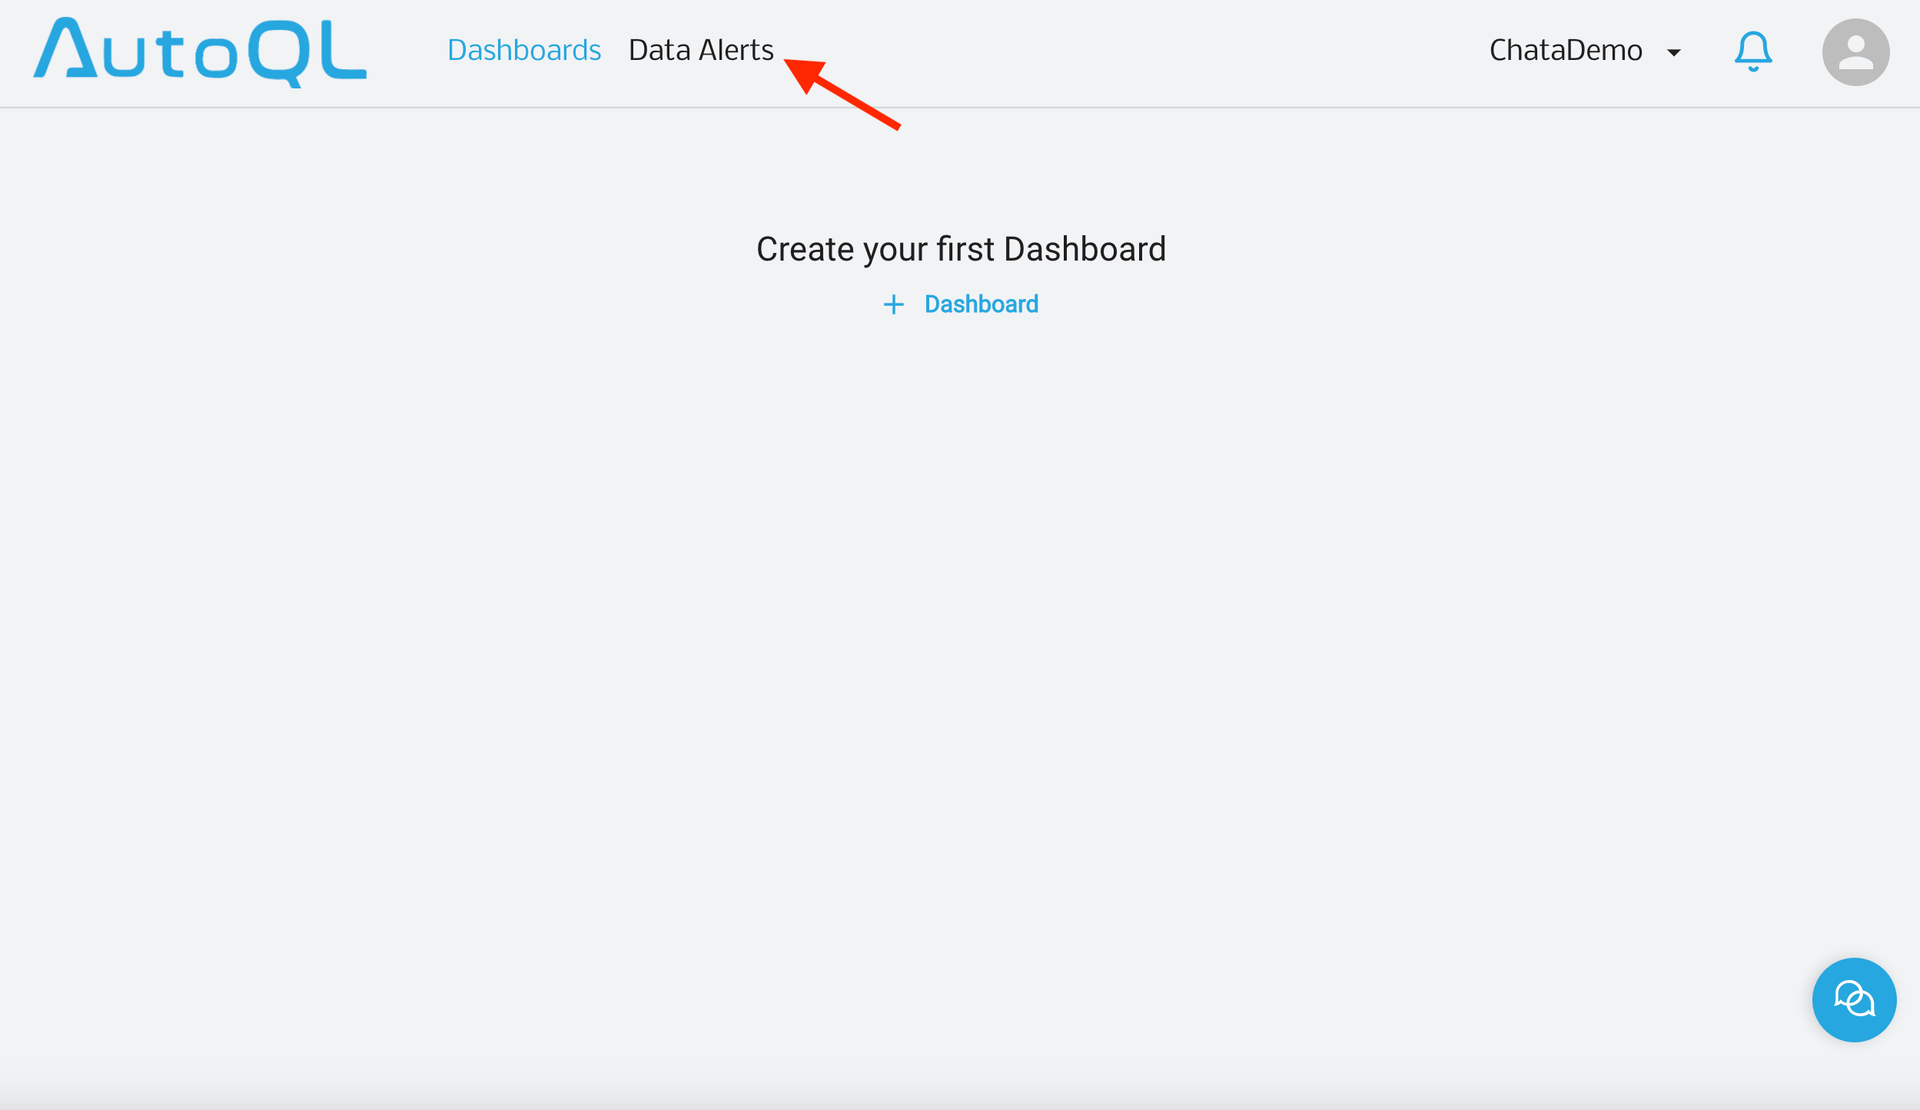
-
If you need to edit, pause or delete an Alert, click on the Data Alerts tab on the home/default screen of AutoQL.
-
You’ll receive a list of all the Custom Data Alerts you’ve created.
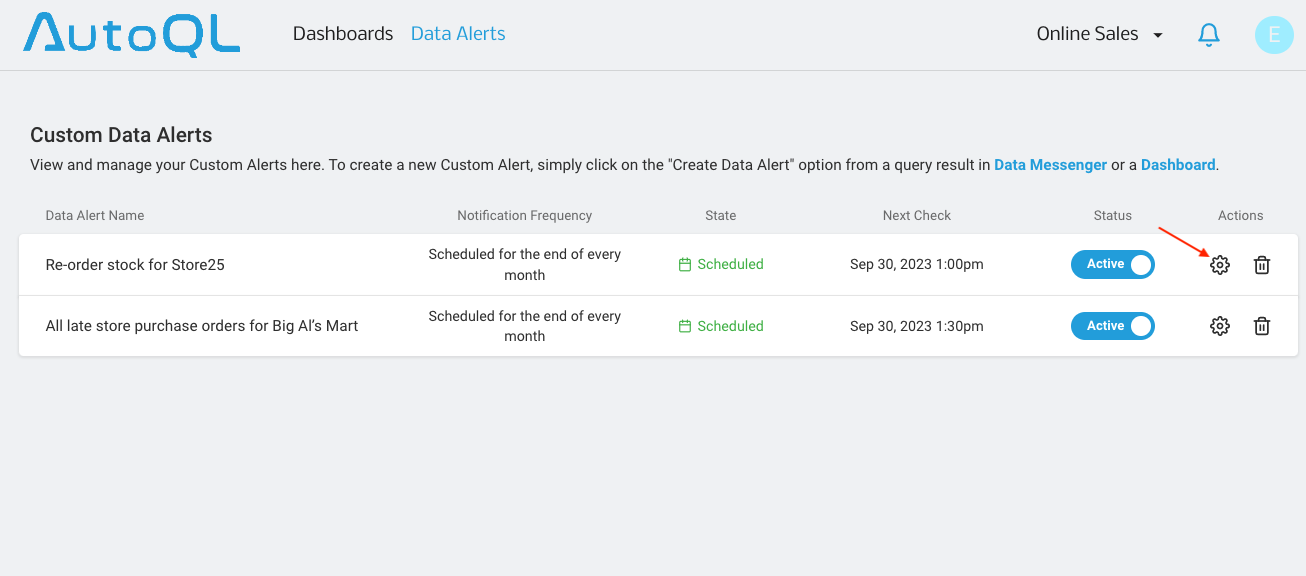
-
To modify an Alert, hover over the Alert and select the gear icon to the left of the alert name.
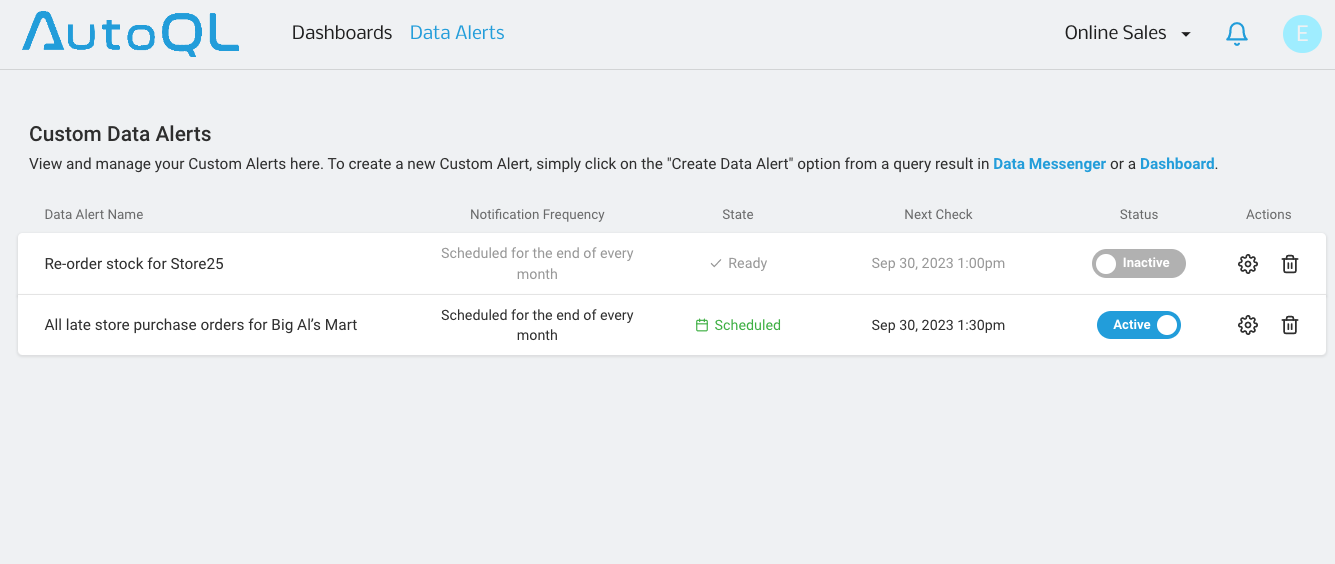
-
To turn off an Alert, click on the toggle to the left of the alert name (the toggle will turn grey when the Alert is off).
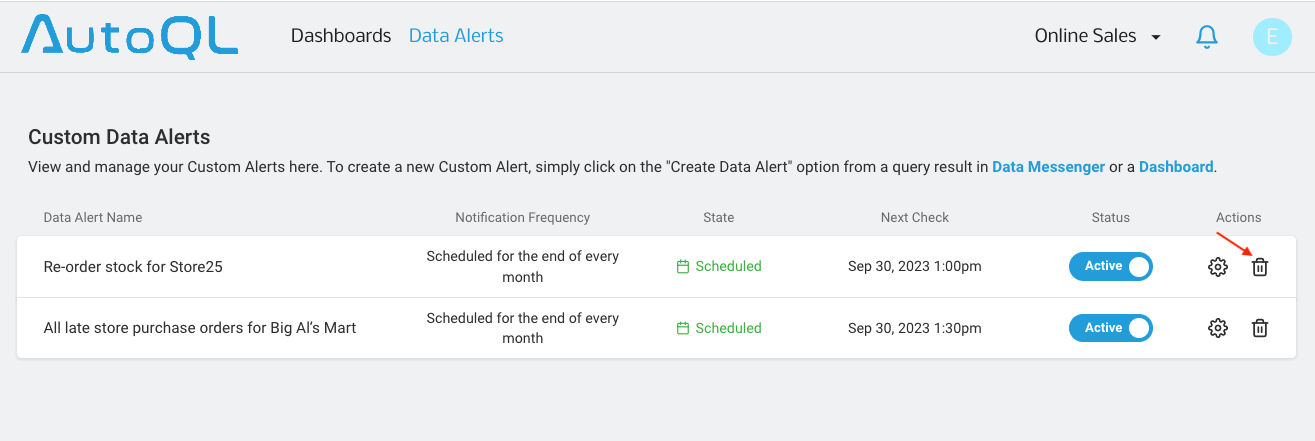
-
To delete an Alert, hover over the Alert and select the trash can icon to the left of the alert name.
Considerations
- Alerts are only supported for queries with date/time measures
- Alerts only work on refreshed data
- Conditions with amounts or currency don't support commas (,) or dollar sign ($) symbols
Updated 11 months ago