Data Messenger User Guide
On this page:
Part 1
Part 2
- Data Messenger Overview
- When to Use Data Messenger
- Accessing & Navigating the Widget
- How to Use Data Messenger
Part 3
- Query Quick Start
- Querying 101
- Query Toolbar
- Visualizations
- Drill Downs & Clear History
- Adding Additional Columns to Data Query Results
- Managing & Locking Filters
- Tips for Asking Great Queries
- Window functions
Part 1
About this Guide
This document serves as a resource for Integrators to leverage as they roll out their custom AutoQL solution in their own application and begin introducing Data Messenger to their internal team(s) and to their end users. Integrators are welcome to reference this Guide for learning and training purposes and are encouraged to pull content and edit it to supplement their existing User Documentation or other resources as they see fit.
Check out our 3-Minute Demo of Data Messenger below, or keep reading to learn more.
To help with understanding, it’s first important to establish commonly understood terminology. In this section, we'll introduce (or reintroduce) a number of key terms that are referenced throughout this document:
What/who is an Integrator?
- An Integrator is a software development company or software solution provider that implements AutoQL in their application.
At its core, AutoQL is a robust AI system that operates behind-the-scenes to make it possible for users to access, search, and analyze their data within the software they are working in, using natural language. This conversational data interaction takes place via a powerful and easy-to-use conversational user interface (such as Data Messenger) that is embedded within the Integrator's software solution.
What is AutoQL?
- AutoQL is an embeddable conversational AI solution for database access. It is a powerful system comprised of several machine learning models that work together to enable the dynamic translation of natural language to database query language. The dynamic translation from natural language to database query language makes it possible for users to access data from their databases quickly and easily, simply by asking questions in their own words.
To bring the power of AutoQL to users and enable a high degree of of accessibility, our team has built a number of front end widgets that Integrators can customize and embed in their own applications, however they like. All widget components are MIT licensed and open source. Alternatively, Integrators can opt to build their own reporting UI or interact with the AutoQL API directly. In this document, we'll cover what Integrators need to know to introduce and roll out one of our front end widgets -- Data Messenger -- as a conversational user interface in their software.
What is Data Messenger?
- Data Messenger is a customizable conversational user interface (CUI) that facilitates database querying and analysis through natural language.
Regardless of software solution type or the range of offerings made available by a provider, Integrators develop and sell their software application or web-based solution to other businesses. We refer to these businesses as Integrator Customers (Customers).
What/who is a Customer?
- A Customer refers to a business or group that pays to use the software application that has been developed by the Integrator.
When Customers purchase a software app or license from an Integrator, they make it available for use within their own companies. Software solutions are sometimes used by everyone within a company, but other times, only certain departments or individuals are given access. Regardless of how a software application is adopted by a Customer company, we refer to the individuals who use the software as End Users (Users).
What/who is an End User?
- An End User (User) is any member of a Customer organization who engages with/has access to the software application (hence, any user of the software solution).
In summary:
-
Integrator - Builds or offers a software solution and implements AutoQL within their solution.
-
Customer - Integrator's Customer that purchases/uses the software AutoQL is implemented in.
-
End User - Any individual who uses the software developed/offered by the Integrator.
Instructions for Integrators
This User Guide is written for Integrators to help them introduce Data Messenger to their Customers and Users.
Check out this video for tips on how to introduce Data Messenger to your Customers and Users:
Detailed information about how to implement Data Messenger (including how to customize the UI to meet your brand requirements and preferences) can be found in the Building a Conversational UI section of our Developer Docs.
This Guide is an adaptable resource for IntegratorsIt is not a step-by-step guide for implementing the widget itself. Therefore, this Guide is written under the assumption that the Data Messenger widget has already been implemented in your software solution.
As you develop your own User Documentation and resources, we recommend that you:
- Replace any examples we have provided with examples that are relevant to your application and to your users.
- Replace any images or recommended copy/assets we have provided with images, giphys or videos of Data Messenger working within your own interface.
- If you have opted out of, or turned off, any of the features outlined in this Guide, be sure to remove them for your own User Documentation.
Important ReminderThe remainder of this doc is written from the perspective of the Integrator, as directed to their own Customers and Users.
Let's get started!
Part 2
Data Messenger Overview
Data Messenger is a conversational user interface (CUI) designed to facilitate natural language (NL) database querying and analysis. It is a new feature (or tool) that has been embedded in our application and brings new value to users by enabling you to seamlessly access, search and analyze your data, simply by asking questions in your own words. Data Messenger gives you greater agency over your data-related needs in our software.
Check out this 5-minute video to learn about all the key features of Data Messenger:
Conversational User Interface (CUI)
- A conversational interface is a digital user experience that enables users to interact with software solutions following the principles (or expectations) of a human-to-human conversation. In the context of Data Messenger, the user can query their data conversationally (using their own words) and Data Messenger will return relevant data in real time.
Natural Language Database Querying
- Natural language database querying is the act of requesting information from a database through natural language queries (or more simply, through human language). Natural language queries consist only of normal or everyday terms (terms easily understood or used conversationally in the user's natural language), allowing a user to enter a query and receive information from their database, without needing to write database query language.
Data Messenger allows you to easily and intuitively access your data straight from the source in real time, without interrupting your workflows or requiring you to navigate to a spreadsheet or a BI tool. Just ask data-related questions in your own words and receive relevant responses within seconds!
References made to Data Messenger and the "widget"Throughout this document, Data Messenger is referred to as “Data Messenger” and the “widget” interchangeably. For the purposes of this Guide, these terms are considered to be synonymous.
When to Use Data Messenger
Data Messenger lends itself to a wide variety of use cases, but here’s a few core examples of when you might use this feature:
To Expedite Ad Hoc Reporting
Data Messenger empowers you to quickly and easily access your data on demand, 24/7. Whether you need information on-the-go, in the middle of an important call or meeting, or you're looking to run a detailed custom report, simply start by opening the widget and entering a natural language query (a statement in your own words) to get the information you're looking for. No need to submit a support ticket or to request assistance from our team, and no need to wait hours or even days to receive a report! With Data Messenger, you're free to self-serve your data requests on your time, on your terms.
Natural language (NL) query
- A NL query consists only of normal or 'typical' terms in the user's language, allowing a user to enter terms in any form, including a statement, a question, or a simple string of words. Simply put, it is a data-related question a user asks in their own words.
For Efficient & Easy Exploratory Analysis
Data Messenger allows you to explore your data with unprecedented flexibility, and get to the details that matter, faster than ever before. Whether you’re looking to conduct exploratory analysis to test a hypothesis, explore trends or patterns, identify anomalies, or check your assumptions so you can make a key business decision, you can do all of this work within Data Messenger, independently and efficiently. Simply enter a NL query or a series of queries to explore your data and receive real time data responses that tell you what is really going on in your business. Ask follow up questions to analyze a topic or data point more deeply, and take advantage of the various visualizations and other easy-to-use tools like one-click drill downs and filters to quickly uncover critical insights and get the whole data story.
To Streamline In-App Workflows
Data Messenger enables you to streamline your workflows and get work done faster, all within our application. When you need to access data to inform a decision, complete a project, or reference and report on the single source of truth, simply stay in the application, open Data Messenger, and ask questions to get the answers you need, straight from the source, in real time. No need to have multiple tabs open or navigate between the app and other tools or spreadsheets – with Data Messenger, just enter your query and get immediate results. You can even export your data responses straight from Data Messenger to share it in a report or presentation.
Accessing & Navigating the Widget
Recommendation to IntegratorsIn this section, include a graphic or video to showcase where the Data Messenger icon is located in your solution's interface and what your customized version of Data Messenger looks like/appears like to users in your software. Include images or videos to showcase the actions of navigating between tabs/views and expanding or collapsing Data Messenger in your application.
Accessing Data Messenger
To access the Data Messenger widget, simply click on the Data Messenger icon located in the [icon location] of the app/interface.
To close the Data Messenger window, simply click the X icon located in the top left corner of the widget interface.
Navigating the Tabs
One you click on the icon to open Data Messenger, you will arrive at the default/home tab screen. There are three tabs (or views) within Data Messenger. These are displayed on the left-edge of the Data Messenger interface.
- The first tab is Data Messenger (default/home).
- The second tab is Data Explorer.
- The third tab is Notifications.
To navigate from Data Messenger to Data Explorer or Notifications and vice versa, simply click between the respective tabs.
Expanding your View
There may be instances where you want to stretch the Data Messenger window in order to expand your field of view for a particular visualization or to see more columns within a table.
To expand the Data Messenger interface, simply click on the edge of the widget, and drag and pull the edge in the direction of the opposite side of the interface. To collapse or shrink the field of view, simply click and drag the edge back in the other direction.
How to Use Data Messenger: Intro to the Interface
As mentioned previously, when you open Data Messenger, you'll see three tabs: the default (or home) Data Messenger tab, Data Explore, and a Notifications tab. Simply click between the respective tabs to toggle between them.
Data Messenger (Default) Tab
Data Messenger is the default view or "home" interface, where you can quickly and easily enter natural language (NL) queries to access data from your database.
In this view, simply ask questions that pertain to the data you wish to explore or see, and receive a response within seconds.
Data Messenger supports a range of flexible visualization options, a variety of exporting capabilities, and several other tools designed to facilitate seamless conversational data experiences, each of which is covered in greater detail later in this Guide.
Unsure about what to ask or how to phrase your NL queries? Look to the Data Explore tab for guidance and ideas to help you get started.
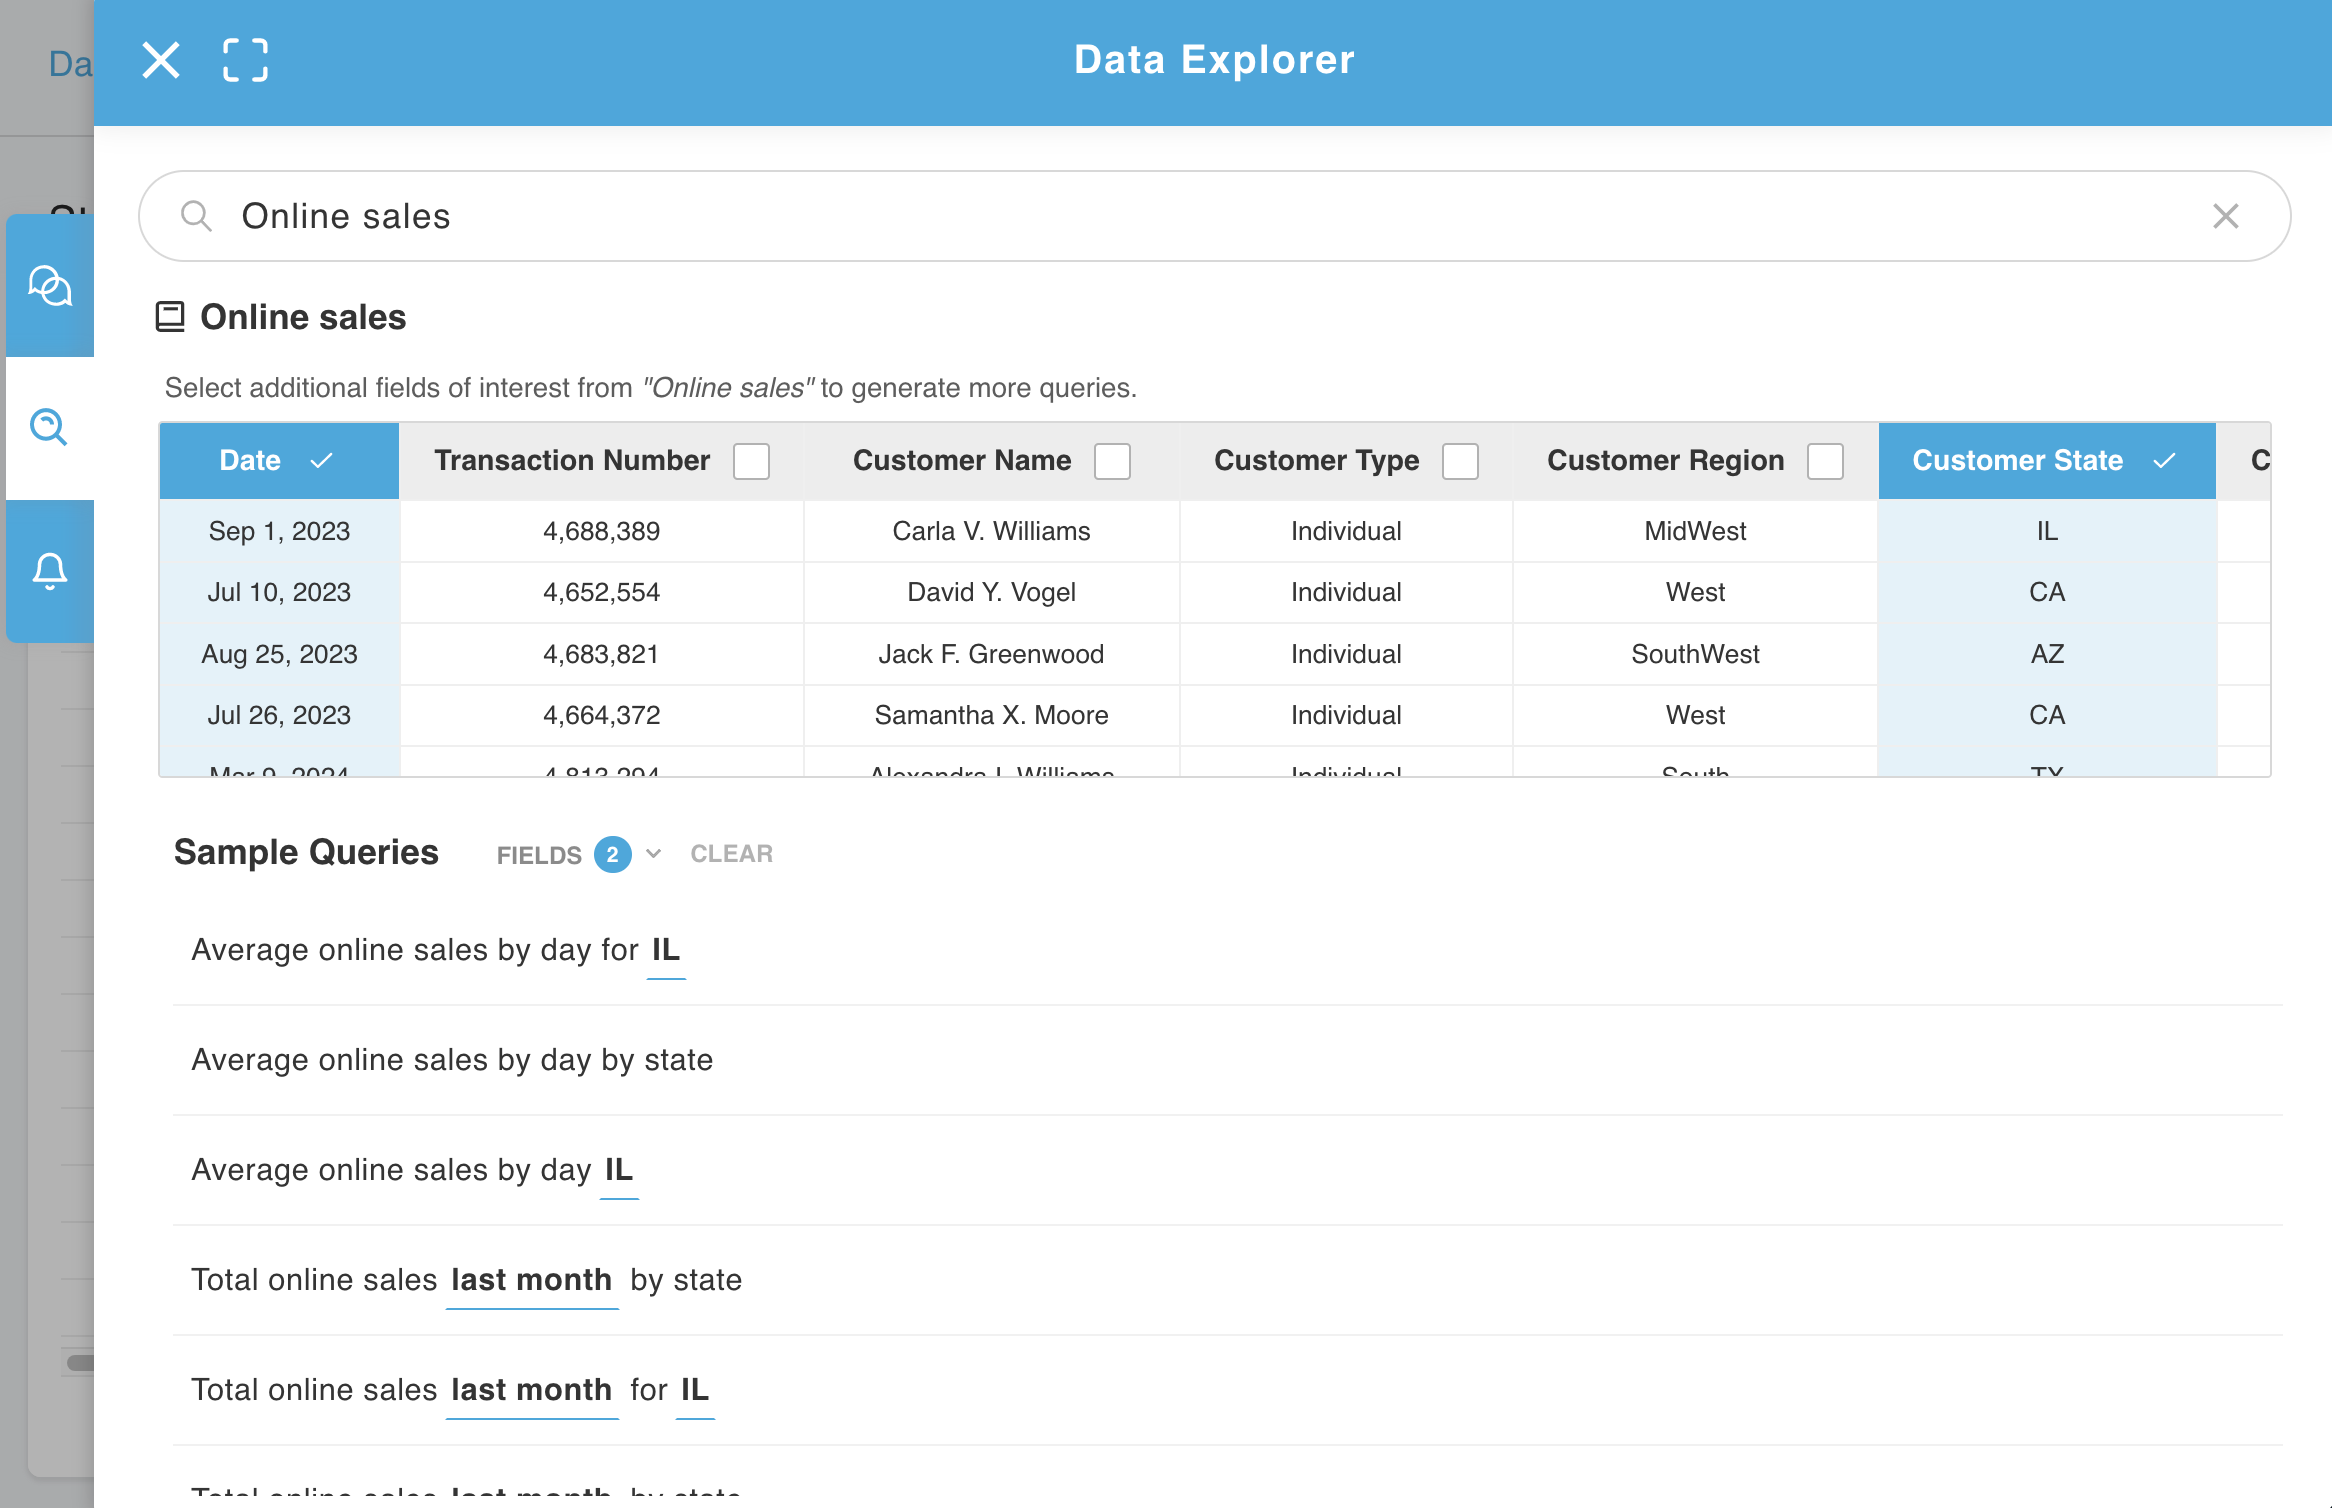
Data Explorer Tab
Data Explorer is a separate tab/view available within Data Messenger.
This feature empowers you to easily explore what data is available to you, and discover relevant queries you can ask in relation to that data. Here, you can search for a topic of interest (this may be a subject in your database (i.e. “customer”), or a value label contained in your database (i.e. Johnny Depp (customer name), and you will receive a list of natural language queries you can ask pertaining to your input. Select additional fields of interest to generate more queries. Within the sample queries list, click on any query to run it and receive a data response.
Part 3
Getting Started: Query Quick Start
Learn how to get started successfully in Data Messenger using our user-first onboarding features:
Recommendation(s) to Integrators:Include an image or a video in this section to showcase the Query Quick Start feature in your customized version of Data Messenger.
Remember: the topics displayed in Query Quick Start should reflect some of the most common areas of interest, or most commonly queried topics in your database.
Why Query Quick Start?
Query Quick Start helps you quickly get started using Data Messenger. The goal of this feature is to inspire you with examples of different topics you may be interested in and to show you relevant queries you can ask or run in order to easily get the answers and information that is important to you.
Using Query Quick Start
When you open Data Messenger, you'll see that the Query Quick Start feature is displayed directly under the welcome message. To see examples of queries you can ask that are related to commonly-explored topics, simply click on a topic you are interested in and a short list of recommended queries related to that topic will appear.
If you would like to test or run one of the queries that is returned in the short list, you can simply click on that query to run it automatically and Data Messenger will return the data you've requested within seconds.
To see additional queries related to the topic you are interested in, click “See More” and you will be transitioned to the Data Explore tab where that topic will be entered automatically and a search will be run, returning a more comprehensive list of related queries for you to explore.
Querying 101
Recommendation(s) to Integrators:Include an image or video to showcase this feature and the actions/process your users can take in your application.
Share a range of query examples (from simple queries to complex queries) and be sure to exemplify a range of topics in the examples you provide.
How Querying Works with Data Messenger:
To receive an answer to your data-related question in Data Messenger, simply type your question in your own words in the search field and hit Enter. The data you have requested will be returned in just seconds. You can ask a wide range of simple-to-complex queries in Data Messenger.
When you enter a query in your own words, Data Messenger receives your query, understands what you are asking for, and automatically translates your query to a language that your database can understand. The relevant data (or answer to your query) is then retrieved directly from the source (the database) and returned to you in real time. Once you've received your response, you can easily change the visualization, click to drill down into a particular data point, add an additional column (table view only) export your data response, or ask another query.
Core Features: Query Toolbar
Recommendation(s) to Integrators:Include an image or video to showcase this feature and provide examples of when each of the tools in the Toolbar might be useful or valuable for your users.
When you are querying in Data Messenger, you will notice that a Toolbar appears in the top right corner of your data response. The tools available in the Toolbar will enable you to filter results and export your query responses as needed.
Learn about all the tools available to you in the Data Messenger Toolbar:
A summary of the tools available to you are as follows:
Filter
- To filter a data response, select the “Filter” icon. Underneath each column header, you can filter by name, number, and enter criteria such as less than and greater than (</>) to filter numerical values.
Show/Hide Columns
- Opt to only display the columns in a table that contain the data most relevant for your unique purposes. To show or hide individual columns, select the “Show/Hide Columns” icon. Simply select which columns you would like to view and click “Apply”.
Add to Dashboard
- Transform your query into a fully interactive Dashboard tile
Copy to Clipboard
- To copy a data response and move it to an external spreadsheet, presentation, report, or other, just select the “Copy to Clipboard” icon, and paste the data response into your desired spreadsheet or other location.
Download as a CSV
- To download your result as a CSV file, select the “Download as a CSV” icon and open the CSV file on your computer.
Download as a PDF
- To download your chart or graph as a PDF, select the “Download as a PDF” icon and open the PDF on your computer.
Core Features: Visualizations
Recommendation(s) to Integrators:Include an image or video to showcase this feature and provide examples of when each of these visualizations might be used.
Data visualization types are the graphical representations of data (returned as responses to NL queries) that communicate relationships among the represented data points to viewers or consumers of that data.
Learn more about the variety of Data Visualization options available to you in Data Messenger:
Dynamically visualize data using a variety of graphing and charting options. Data Messenger supports several visualization types, as depicted below.
1) Tables
2) Filter Tables
3) Line Charts
4) Pie Charts
5) Bar Charts
6) Column Charts
7) Stacked Bar and Stacked Column Charts
- Note: Only available for queries containing more than one groupable. For example: “Total sales by custom by month this year”
8) Stacked Area Charts
- Note: Only available for queries containing more than one groupable. For example: “Total sales by customer by month this year”
9) Heat Maps
- Note: Only available for queries containing more than one groupable.
10) Bubble Charts
- Note: Only available for queries containing more than one groupable.
Adjust Axis Display
Once a data response has been returned, in some instances, you may notice a small arrow is present beside the x-axis or y-axis label. If this arrow is present, this means the data being displayed on that axis can be adjusted. Click on the arrow to view the different options that are available for you to display on that axis and select the one you would prefer to show.
Adjust Axis feature is only applicable under specific conditionsDue to how specific query responses can be graphed, this axis-adjusting functionality is only available when:
- The query contains multiple groupables or filters AND
- The selected data visualization type is a line chart, bar chart or column chart
Core Features: Drill Downs & Clear History
Recommendation(s) to Integrators:Include an image or video to showcase this feature and provide examples of when drilling down into a data point may be applicable or helpful to your users.
When viewing a query result, there may be times where you wish to uncover the details underlying a given data point. To do so in Data Messenger, you can easily “drill down” to access these details.
Drill Down
- To drill down means to surface or access a deeper level of information — or uncover the underlying details — that make up a given data point.
How to Use Drill Downs
To drill down to access the details underlying a particular data point, enter a natural language query, receive the data response, and then simply click on a particular line item or detail in the graph or chart that is returned.
-
Determine which data point you are interested in drilling into
-
Click on that data point to drill into the underlying details
Note: When you click on a data point to drill down, an additional "drill down query" will be automatically generated from your action and a detailed response will be returned to you within seconds.
Clear History
To clear your query history, simply click on the trash icon located in the top right corner of the Data Messenger interface.
Adding Additional Columns to Data Query Results
Adding a column in AutoQL is a straightforward process, tailored to accommodate various user workflows:
From Data Messenger:
-
Access Data Messenger
-
Input your query with a group-by for analysis
-
Click the plus icon located at the top right corner of the table (note: adding a column doesn’t work in the pivot table view)
-
Select the desired column to add
-
Fine-tune the visual display as needed
From Dashboards:
-
Navigate to the Dashboard you’d like to edit
-
Edit an existing tile or add a new one, ensuring the query includes a group-by
-
Click the plus icon located at the top right corner of the table (note: adding a column doesn’t work in the pivot table view)
-
Choose the column to add from the options provided
-
Adjust the visual representation if necessary
Managing & Locking Filters
When querying in Data Messenger, you may wish to apply filters to help you narrow down results, cut through excess noise, and gain critical insights faster.
Managing filters allows you to “lock” specific filters so that only the specific data associated with that filter will get returned.
This feature is particularly useful in helping narrow down or focus on something particular in the query results. This can also be thought of as “subsetting” the data.
Accessing the Manage Filters Menu
To access the Managing Filters menu, you have two options:
-
Click on the lock icon in the top right corner of Data Messenger, or
-
Ask a query in Data Messenger, then click on a Filter/Value Label in the “Interpreted As” statement – which then opens the Filter Locking menu.
This feature allows you to set your own filter preferences and retain those preferences for the duration of an entire session (session-specific), or to set filters that get retained between sessions and are applied on an ongoing basis over time (persistent). These Lock Settings are described further below.
How to Lock a Filter
To lock a filter:
Navigate to the Filter Locking menu
Begin typing in the search bar to find the filter you wish to lock.
Click on a filter to apply/lock it. That filter would then appear in the menu of locked filters below.
Now that a filter has been locked, any subsequent queries you ask will automatically factor that filter in.
NoteLocked filters become visible in the “Interpretation” statement that follows a data response. These can be identified by looking for blue text preceded by a lock icon.
Null Filter Locking
There may be times that you want to include/exclude "null" or non-existent data.
Begin typing in the search bar "NULL" to find the filter you wish to lock.
Click on a filter to apply/lock it.
Click on whether to INCLUDE or EXCLUDE the null data.
Now that a filter has been locked, any subsequent queries you ask will automatically factor that null filter in.
Lock Settings: Persistent & Session-Specific
Filters can be locked on a persistent or session-specific basis.
Persistent:
The filter is locked on a persistent basis unless it gets removed, meaning the filter will remain locked between sessions, so you can pick up where you left off when you return to Data Messenger.
Session-Specific:
The filter is locked for the current session only. If you leave Data Messenger or close your browser and start a new session, the locked filter won’t be retained.
Removing/Unlocking a Filter
If you wish to remove a filter that has been locked or to view filters you have locked, simply click on any filter within an “Interpreted as” statement, or click into the Manage Filters menu at any time.
To unlock/remove a Filter, click on the small trash can icon in the locked filters menu.
Tips for Asking Great Queries
Recommendation(s) to Integrators:In this section, we recommend you provide helpful additional resources and links for your users to learn from.
Some ideas include: blogs or instructional content that teaches your users about the value of querying their data through NL and data storytelling, query examples, best practices or tips for drafting effective queries, etc.)
Be Clear and Be Specific
Complex answers don’t always require complex questions. Even if you have a lot of different dimensions or filters you’d like to apply to the data, make sure that each question you ask is about a single topic, or that the relationship between the topics you’re querying is crystal clear.
Understand the Value of Unique Labels
Unique labels are descriptive labels that are associated with different variable in your database. These can include things like customer names, vendor names, product names, and more. To find out what unique labels are contained in your database, try querying a specific theme or topic such as “all customers” or “all vendors” or something even more specific like “all expense accounts”. Having an understanding of the unique value labels contained in your database can help you come up with specific and intentional queries that get you the answers you need, faster.
Structure Your Queries Intentionally
When it comes to querying your data, there's a number of strategies or techniques that you can employ to access the data you need quickly and easily. Below are a handful of helpful concepts that you can use when querying your data:
Groupables
Groupables are identifiers connected to a domain that can be aggregated. Use the term “by” to include a groupable, such as:
- Product names (e.g. “Sales by product”)
- Customer names (e.g. "Sales by customer")
- Timeframes (e.g. “Sales by month")
Filtering
- To filter by exclusionary criteria, use terms like “greater than” or “less than”.
- To filter by threshold, use terms like “over” or “under”.
- To filter by time period, use terms like “in the past year” or “over the last 6 months”.
Calculations vs. Lists
- To have a query perform a calculation automatically, use terms within your query that reflect the required calculation within the query such as “total” or “average”.
- To receive a list as a response, use terms within your query like “all” or “list”.
Adding a Column
You can adjust the table to include more columns.
Click the “+” icon and choose from related fields based on the data currently shown in the table.
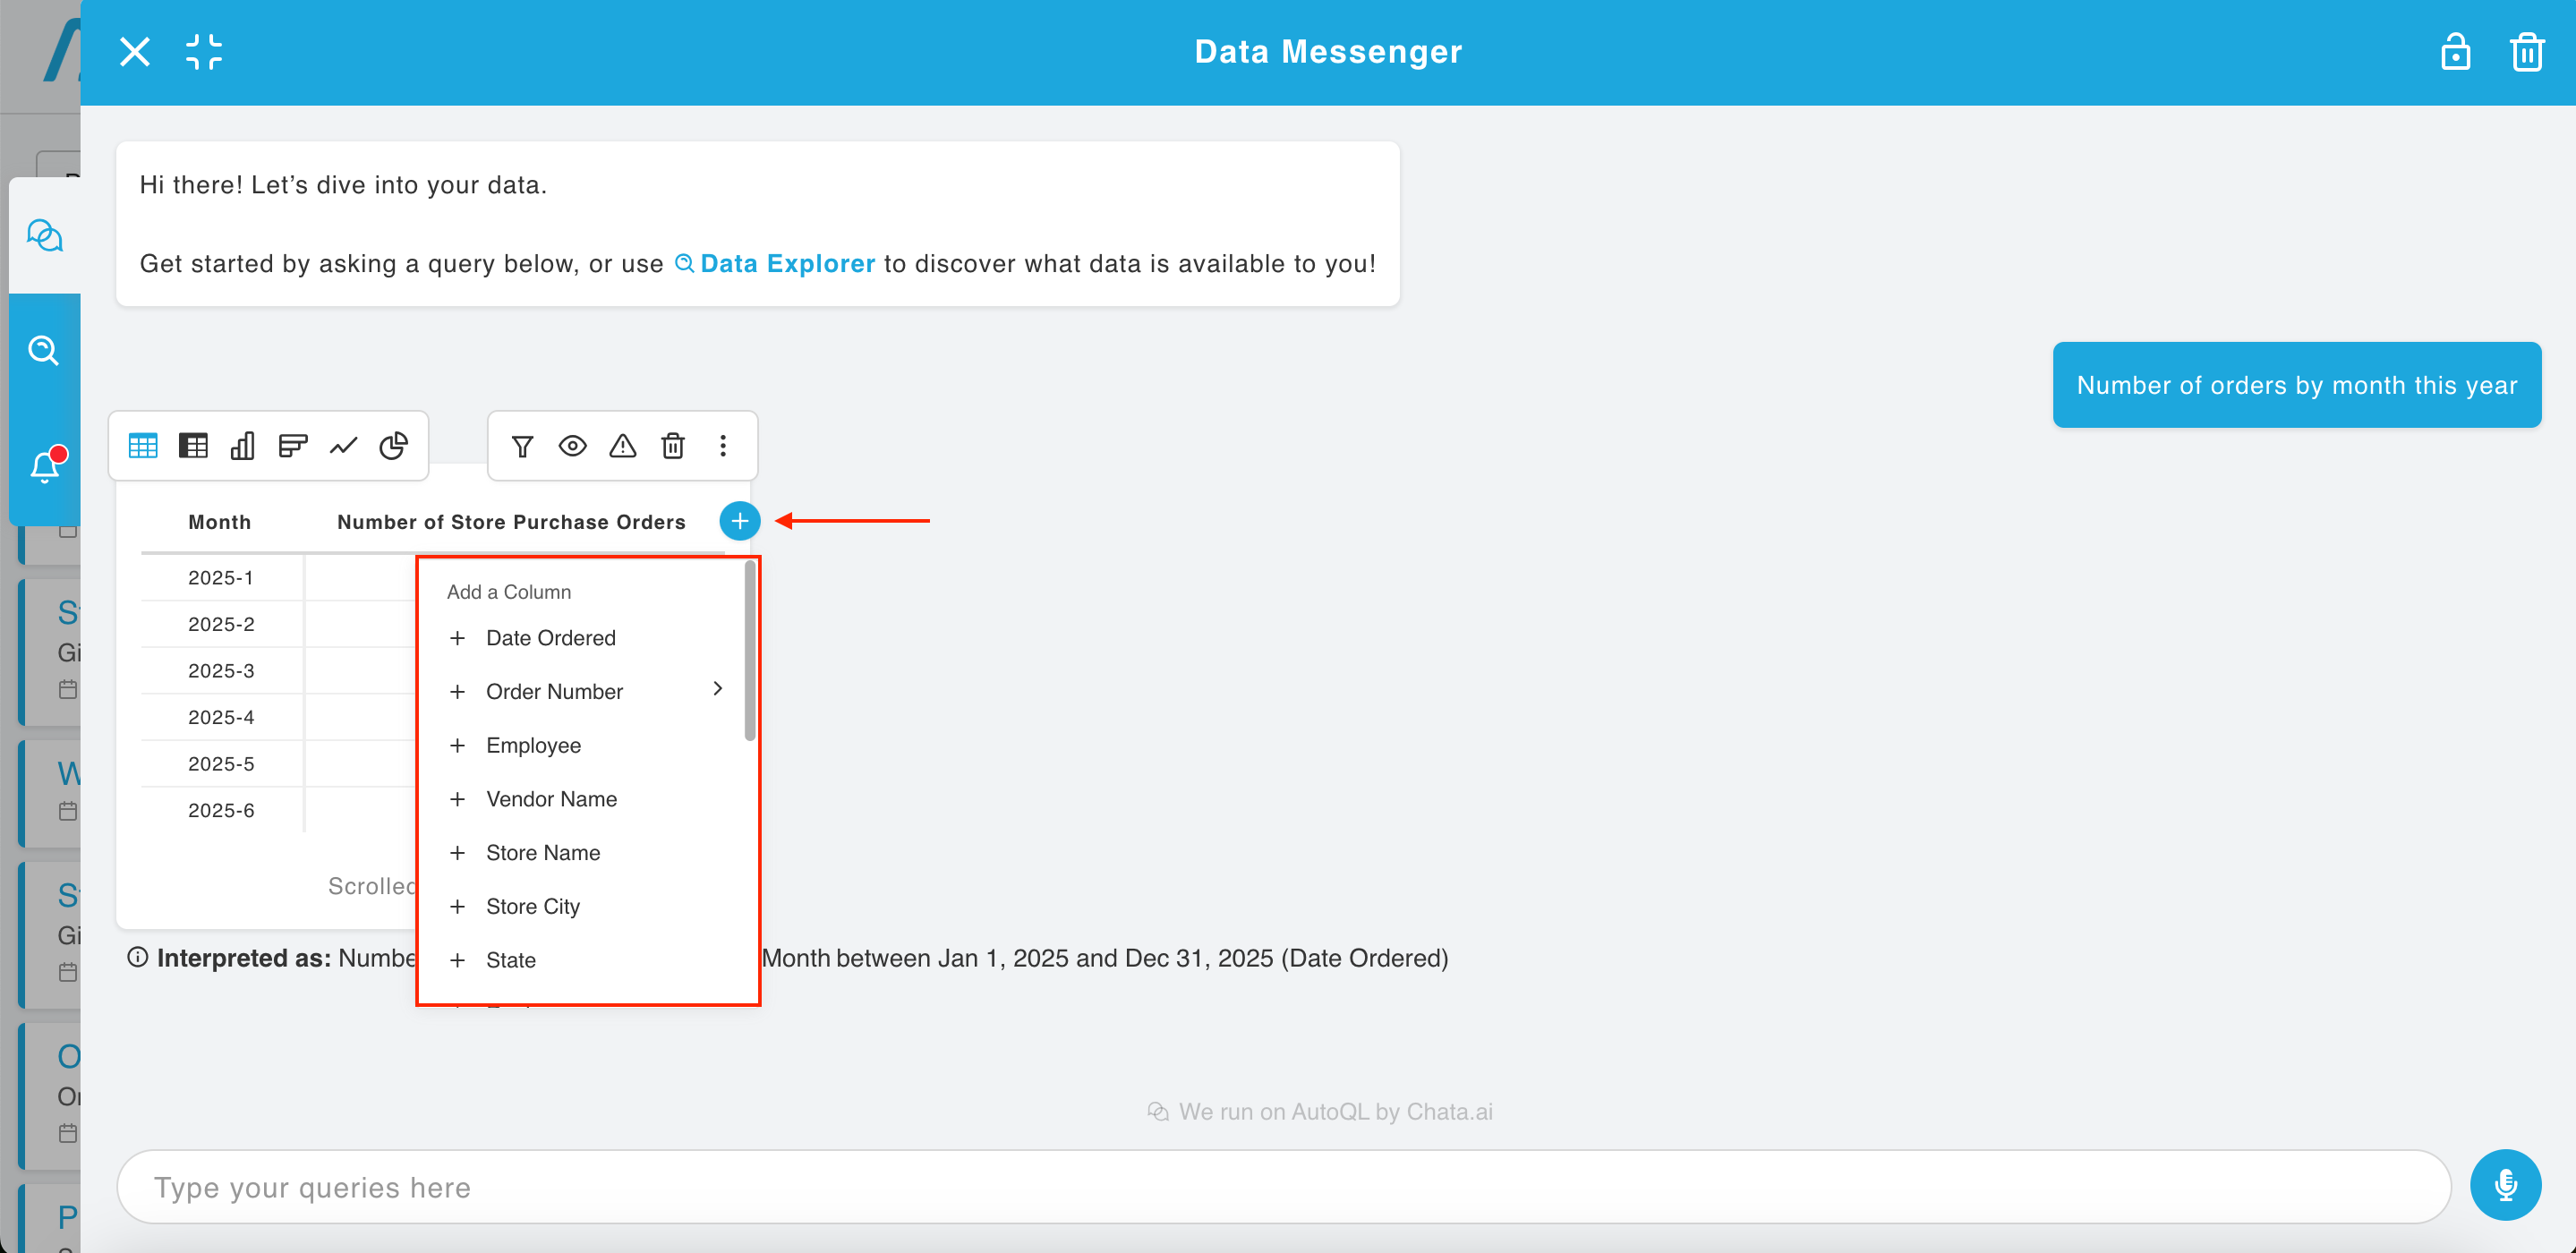
Creating a custom column is also available. Scroll down to find this option at the bottom of the list.
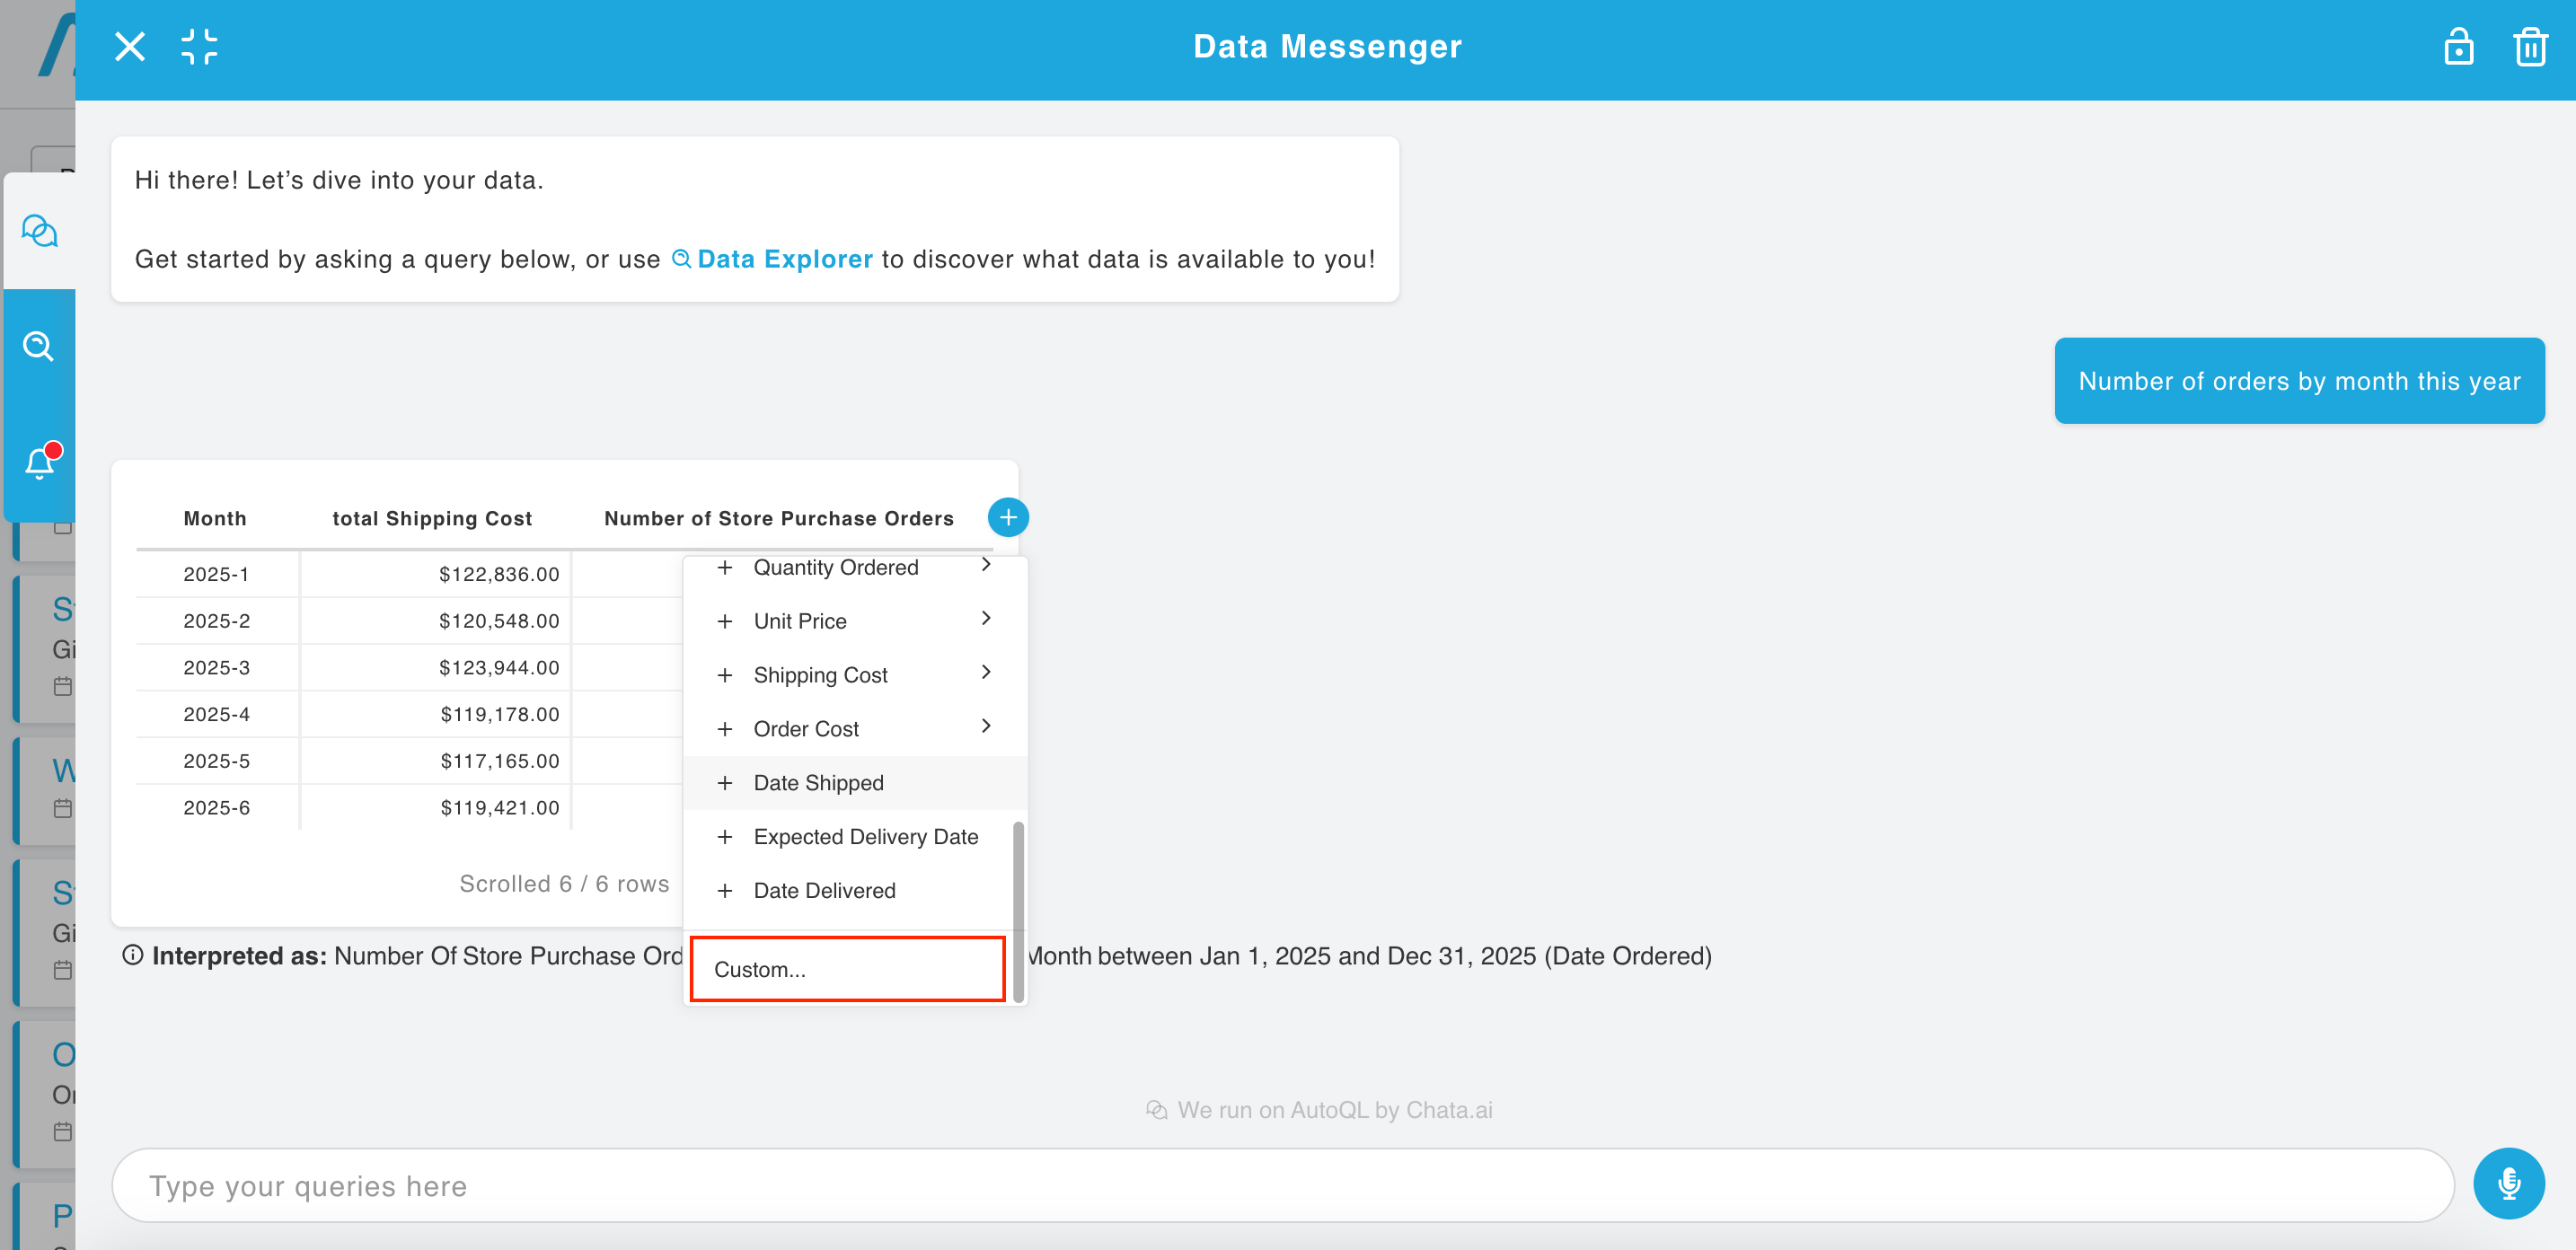
Custom column configuration lets you apply formulas, use variables, work with custom numbers, operators, and window functions.
-
Name a column.
-
Add variables, numbers, and choose the operators you need.
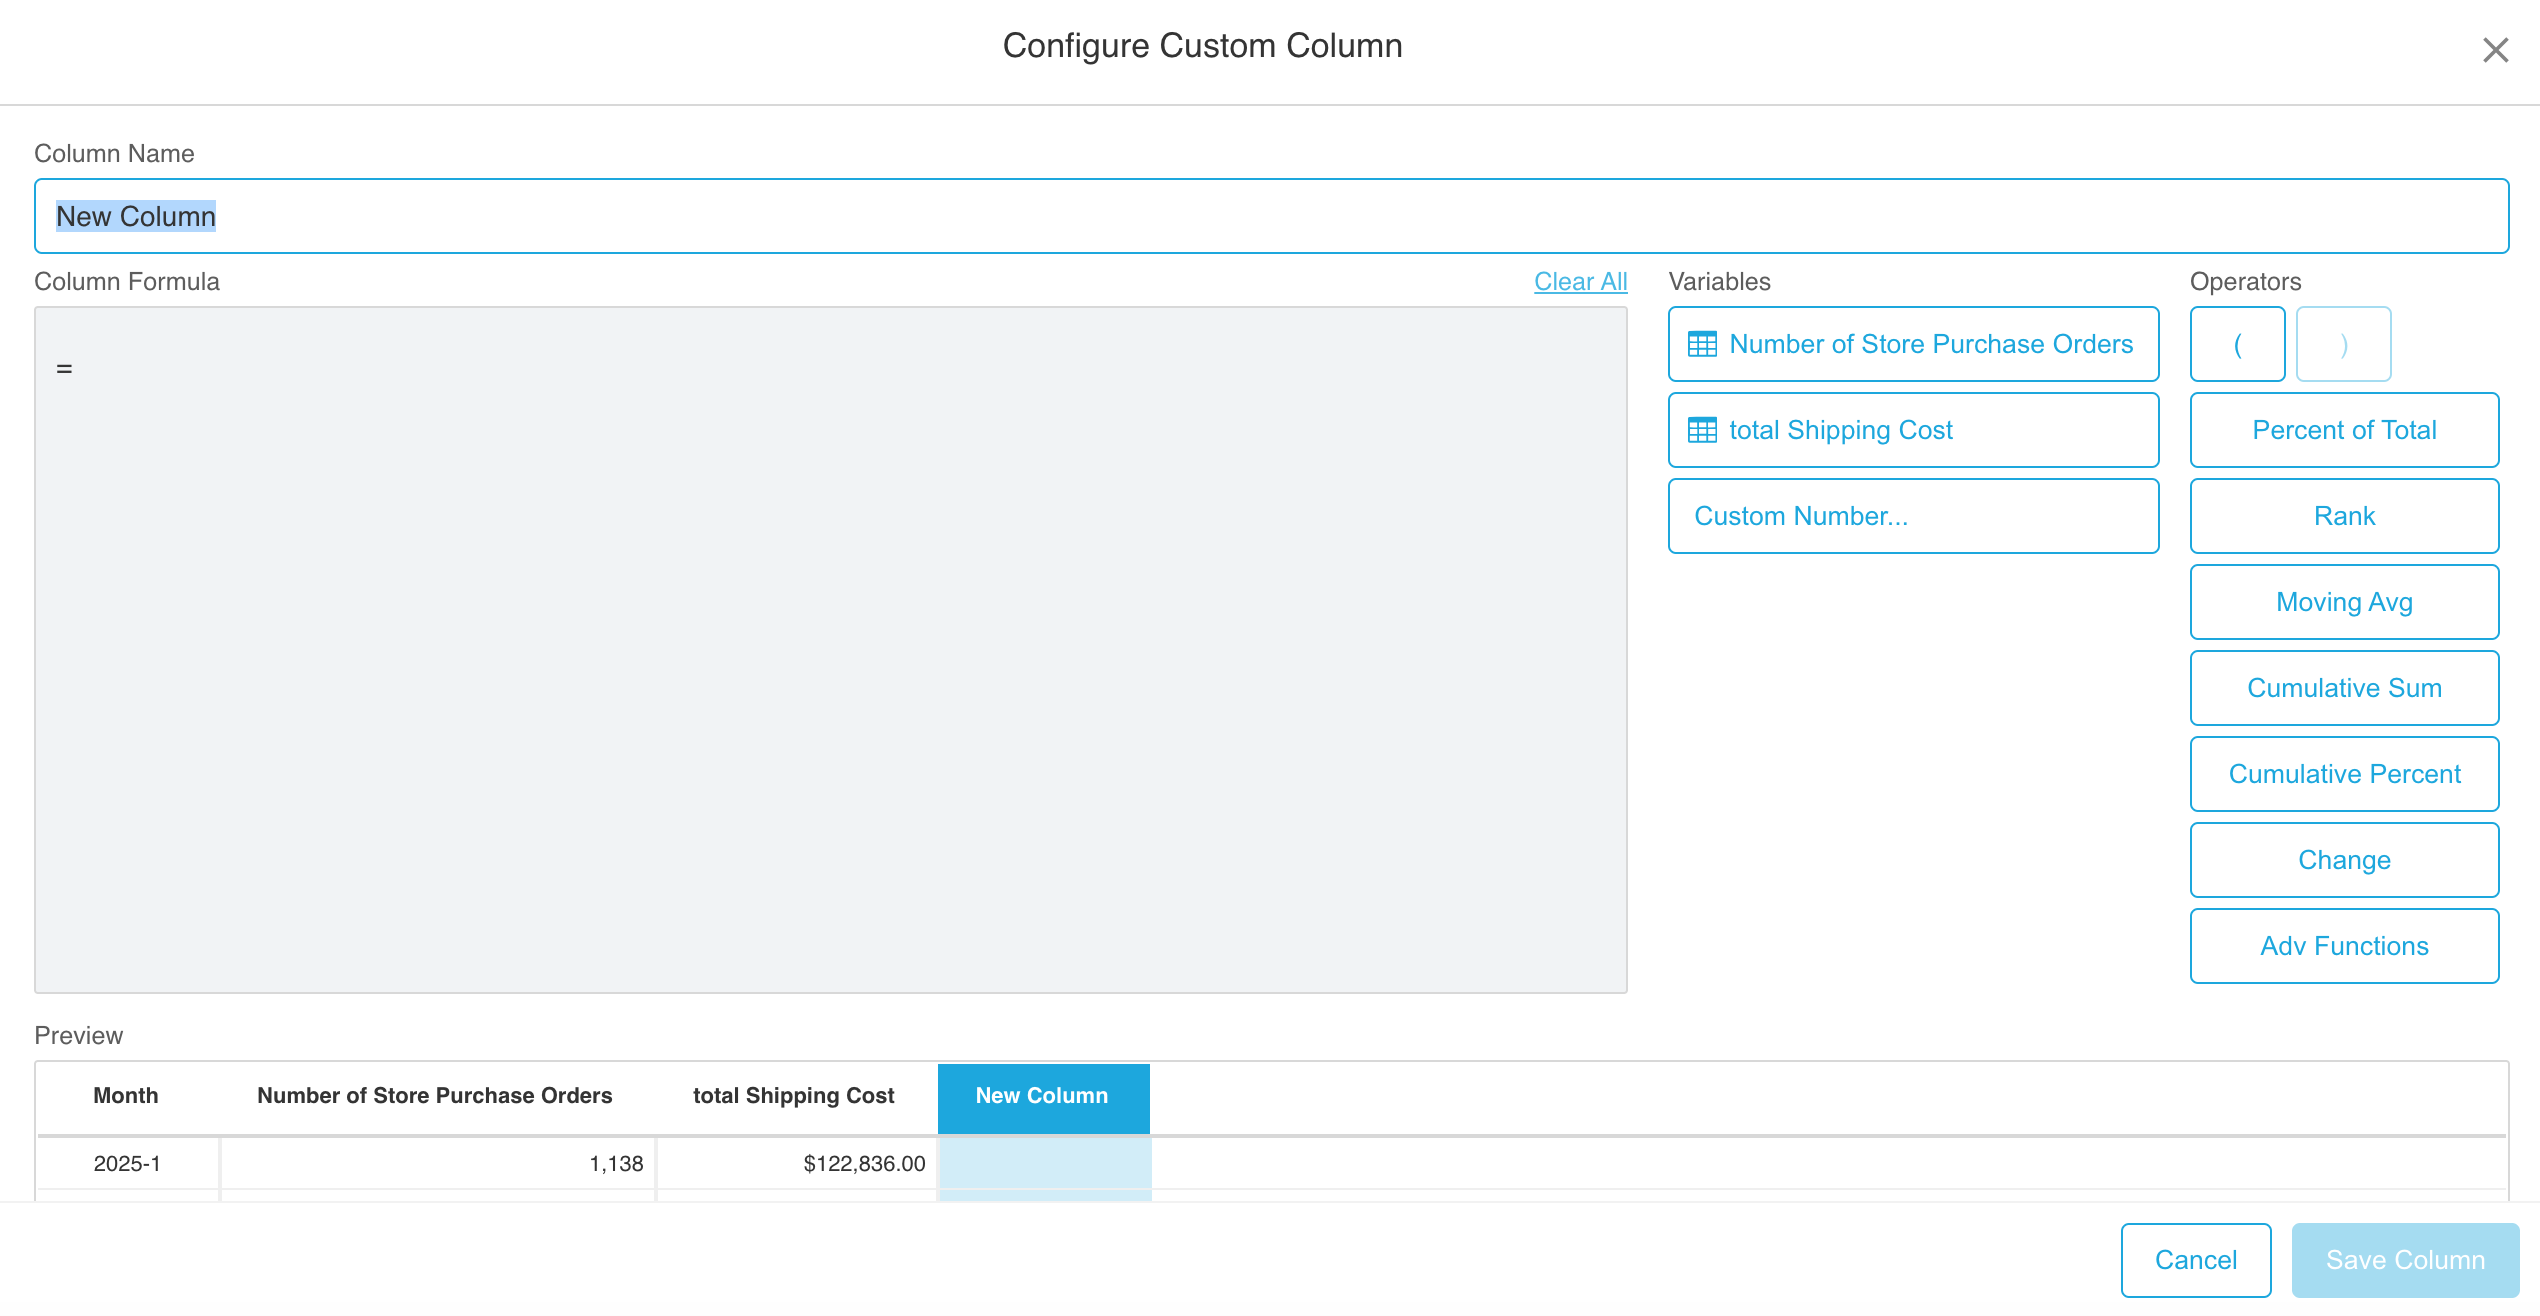
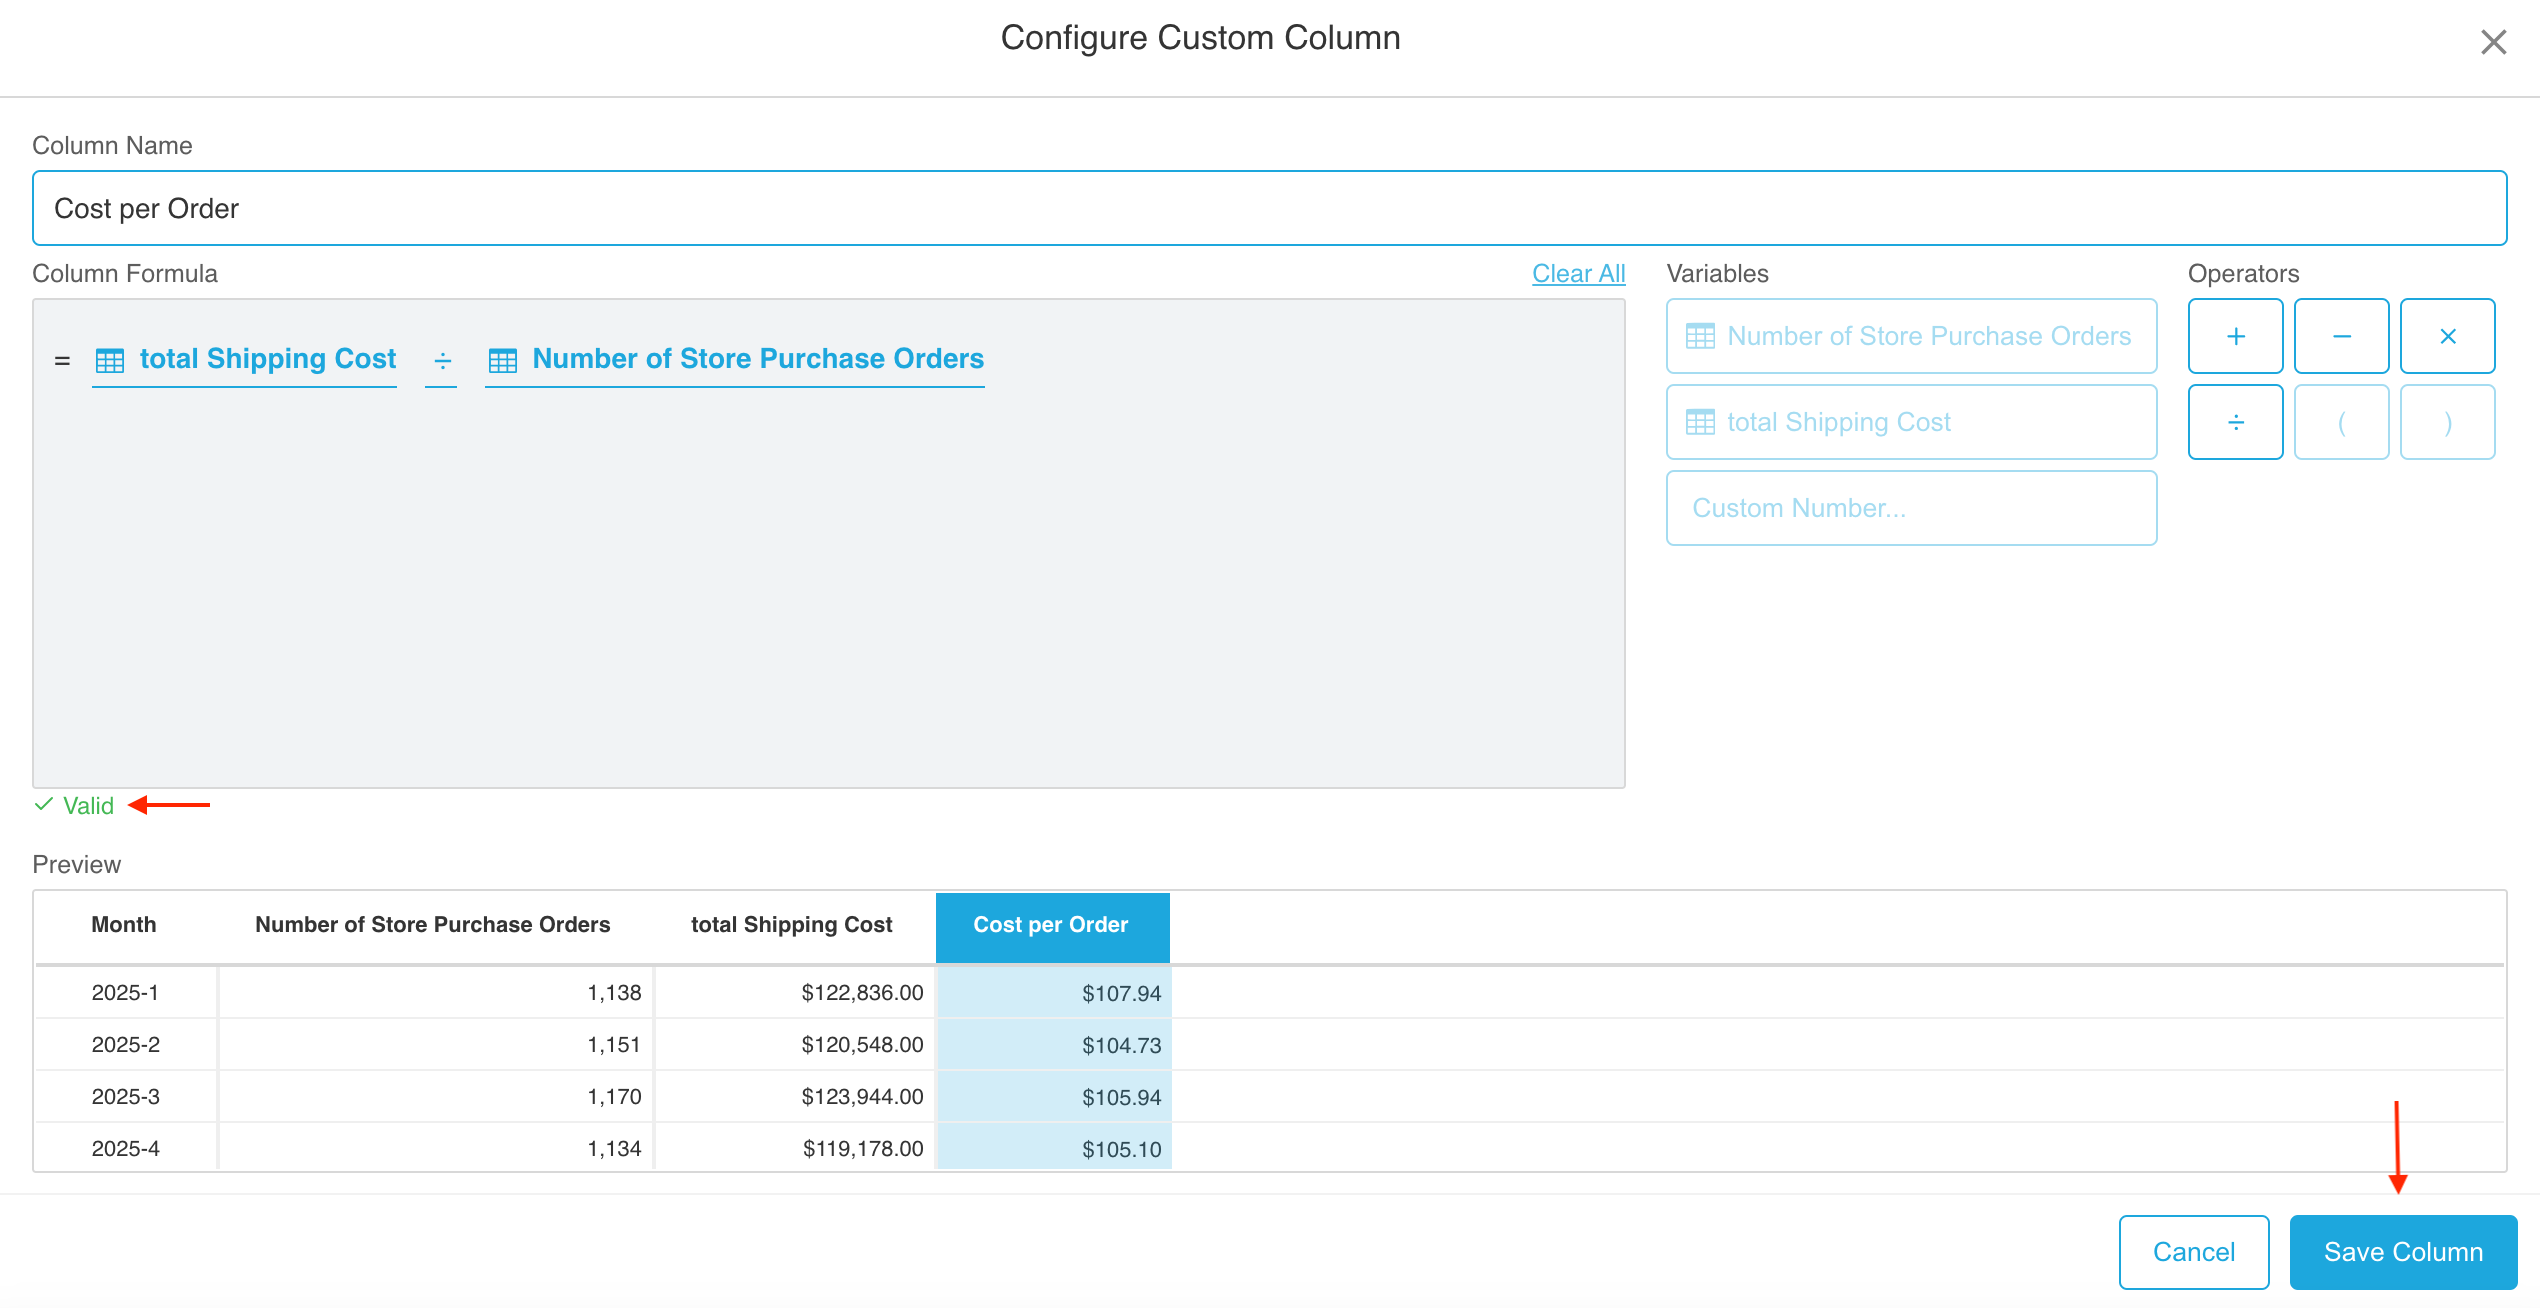
If the values you enter aren’t valid, you’ll see a message explaining the issue.
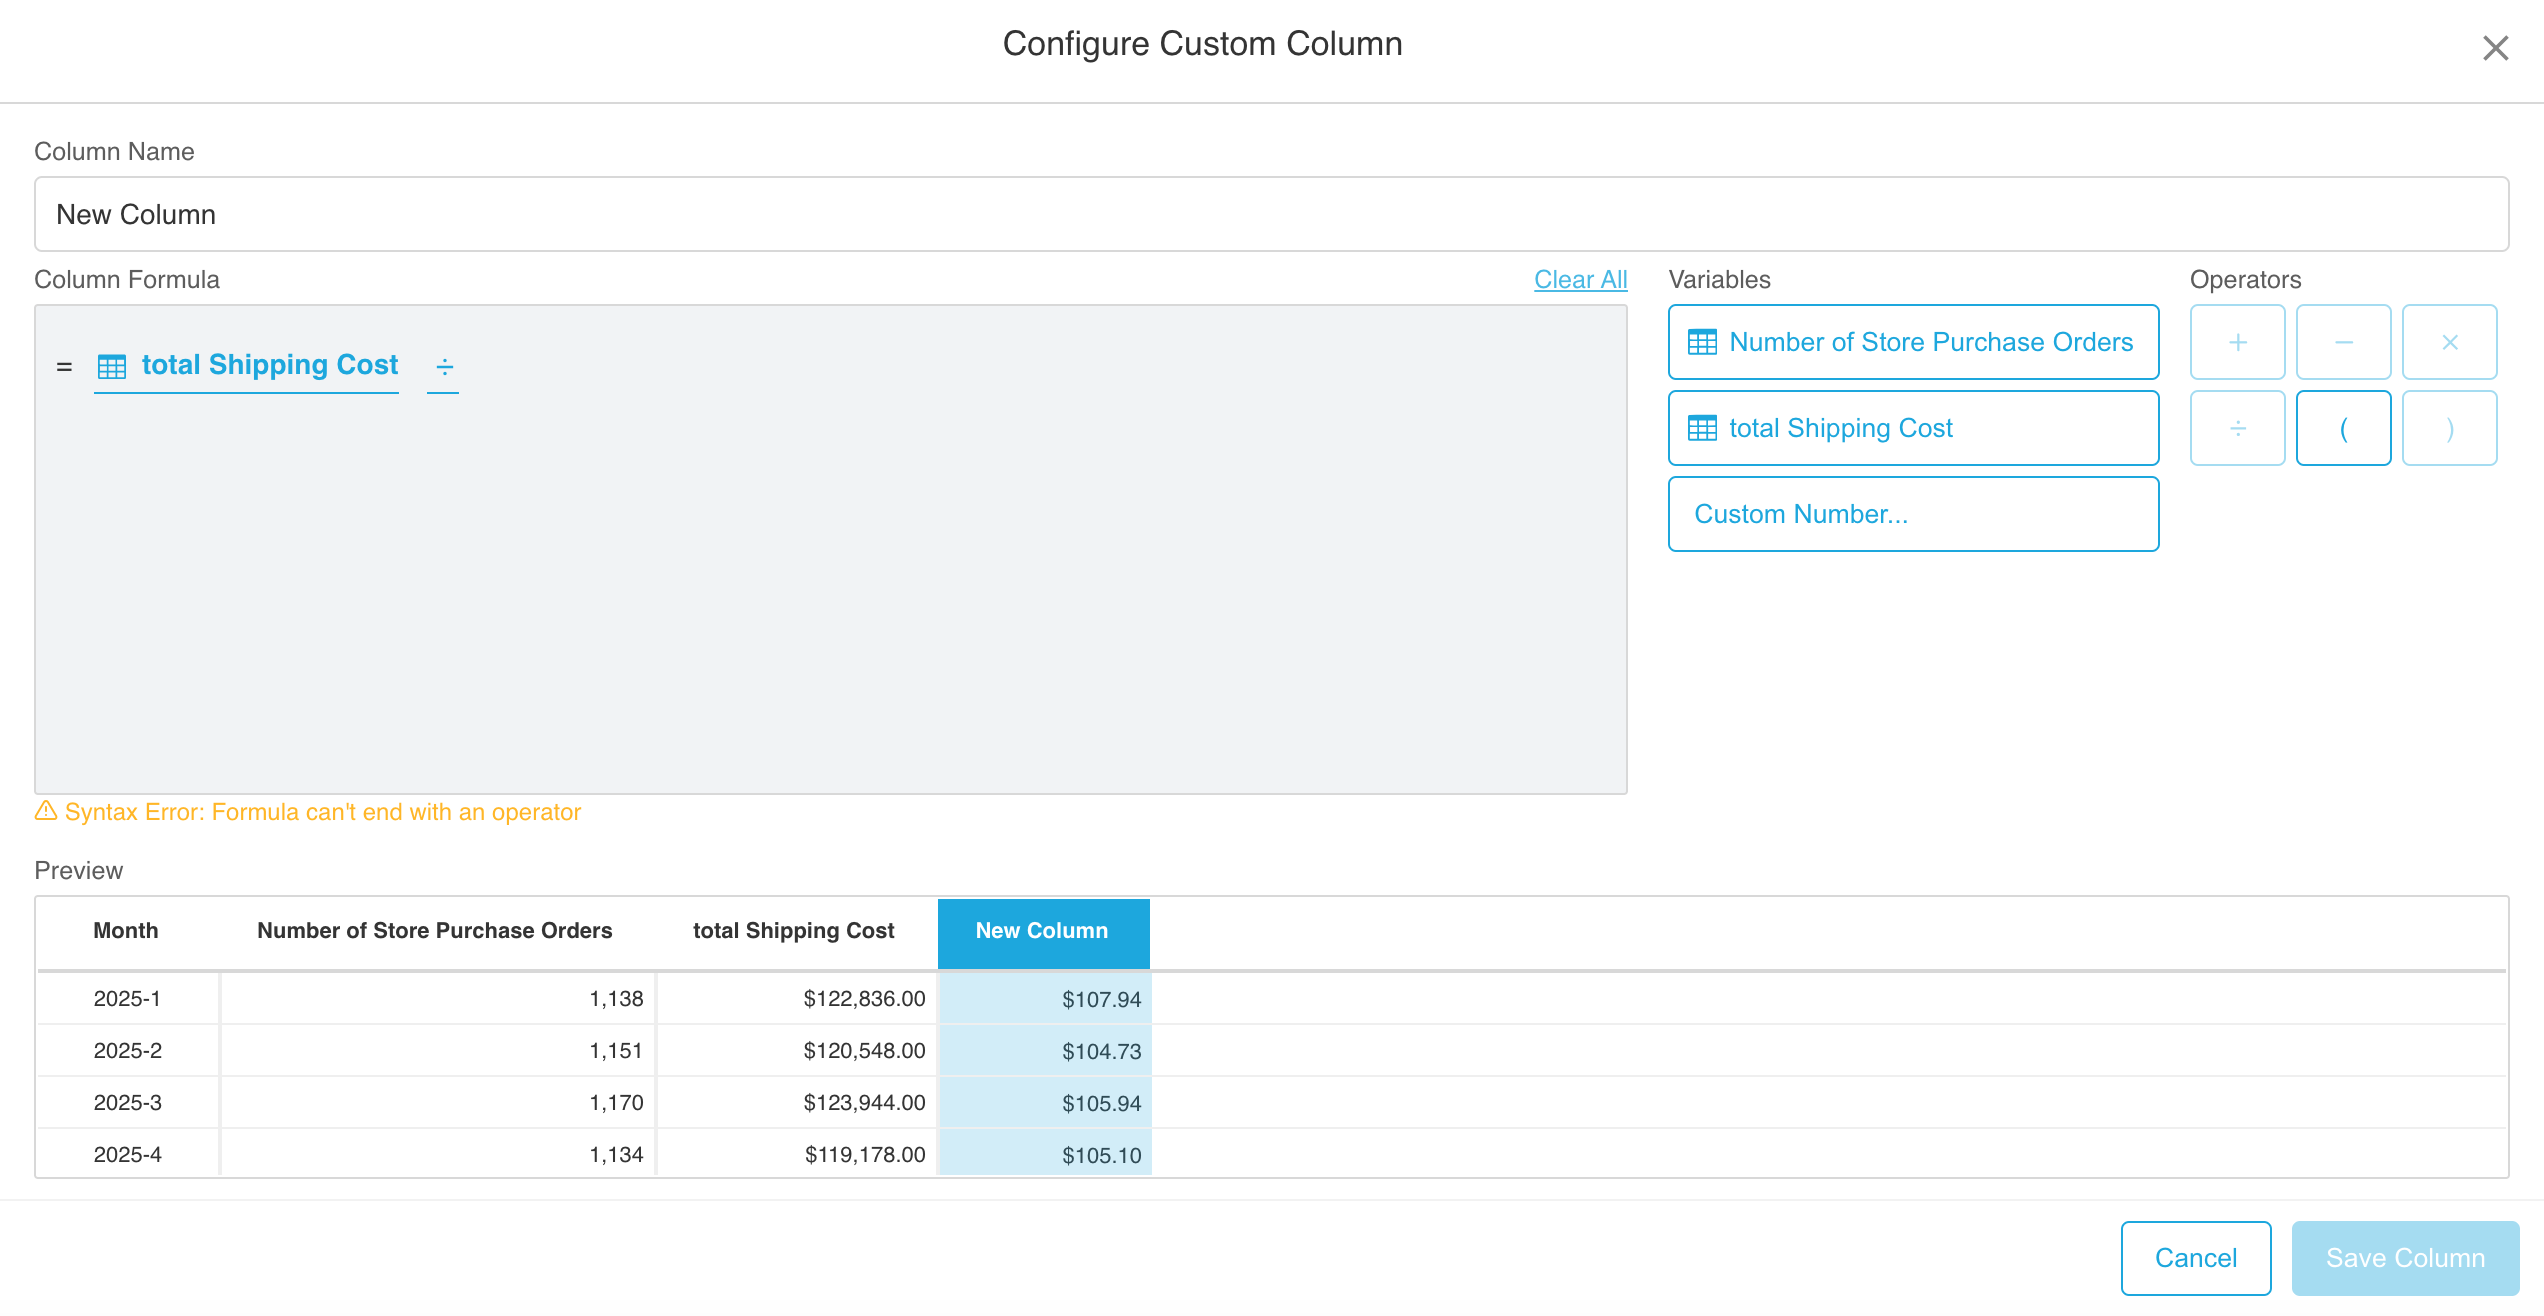
- After the system validates the input, click the "Save Column" button.
Window Functions
Window functions are specialized functions that perform calculations across a set of rows related to the current row, without collapsing the results into a single value. Instead, each row retains its identity and receives a computed value based on a "window" of related rows. With Chata.ai, they work by simply selecting the required items, no need for SQL or complex formulas.
Window functions let you see how things change over time, across groups, or in relation to other values.
How They Work:
A window function operates over a window of rows. This window can be specified using PARTITION BY (to group rows) and ORDER BY (to define order), as well as an optional frame specification (to further limit the rows considered for each calculation).
How to Use Window Functions with Chata.ai
- Start with a Query
Example: Total sales amount by department by month in Q1
This returns the grouped dataset you'll work from. Switch to the table view.
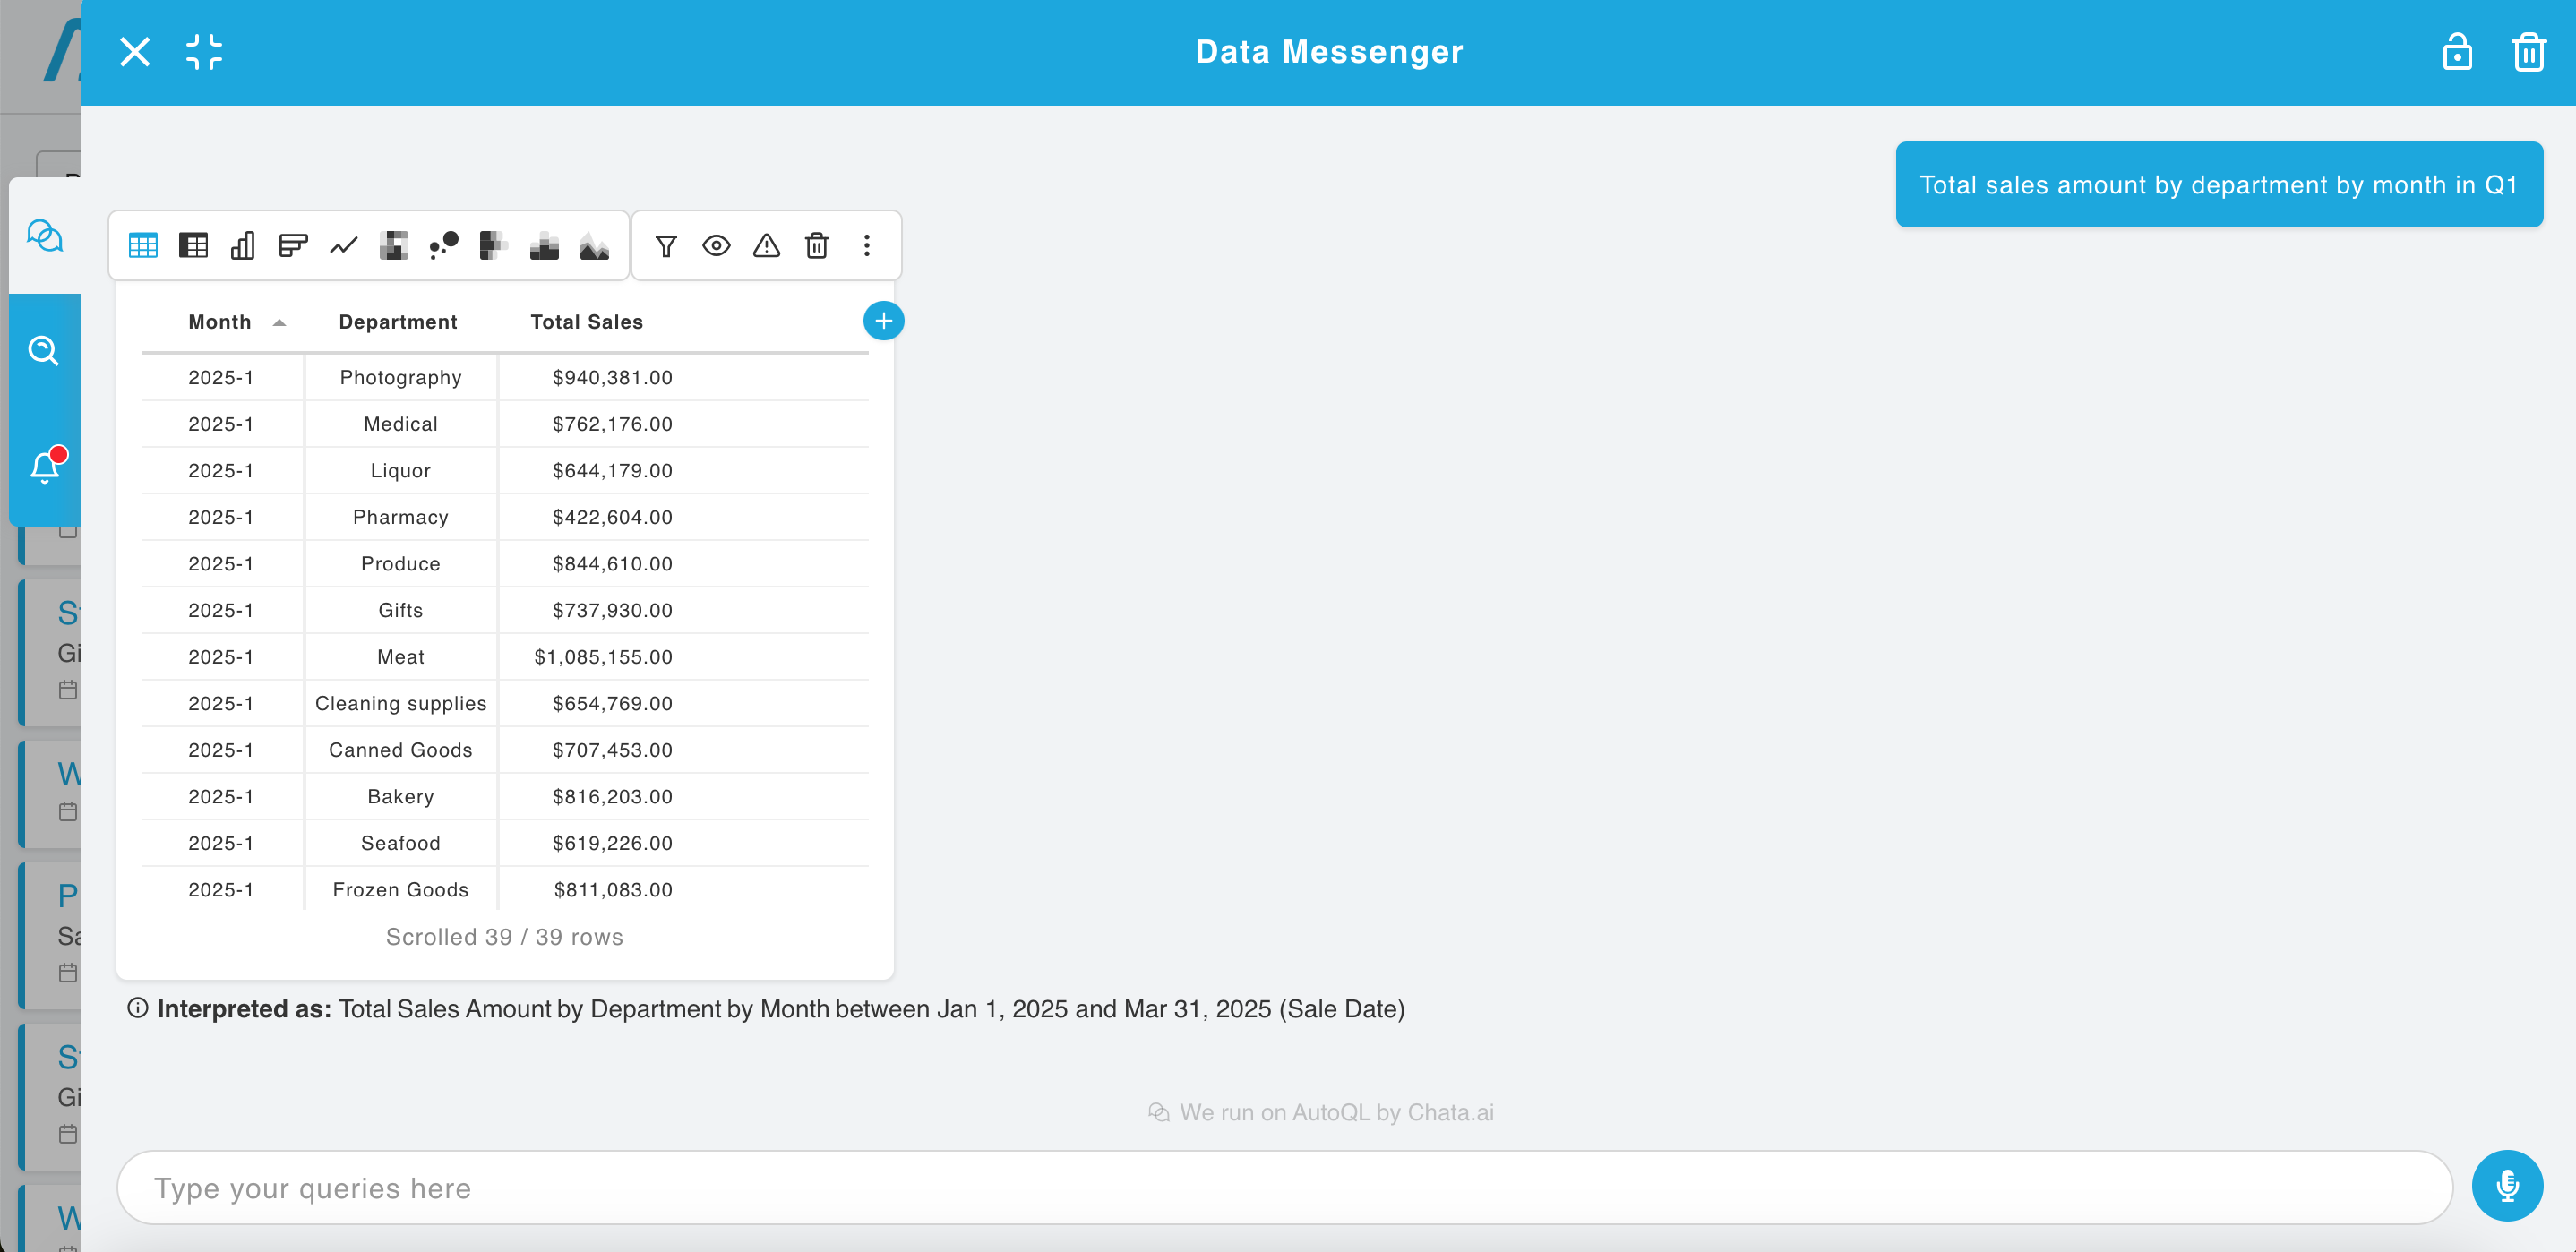
- Add a New Column
In the table view, click the “+” icon to add a Custom Column.
- Choose a Function
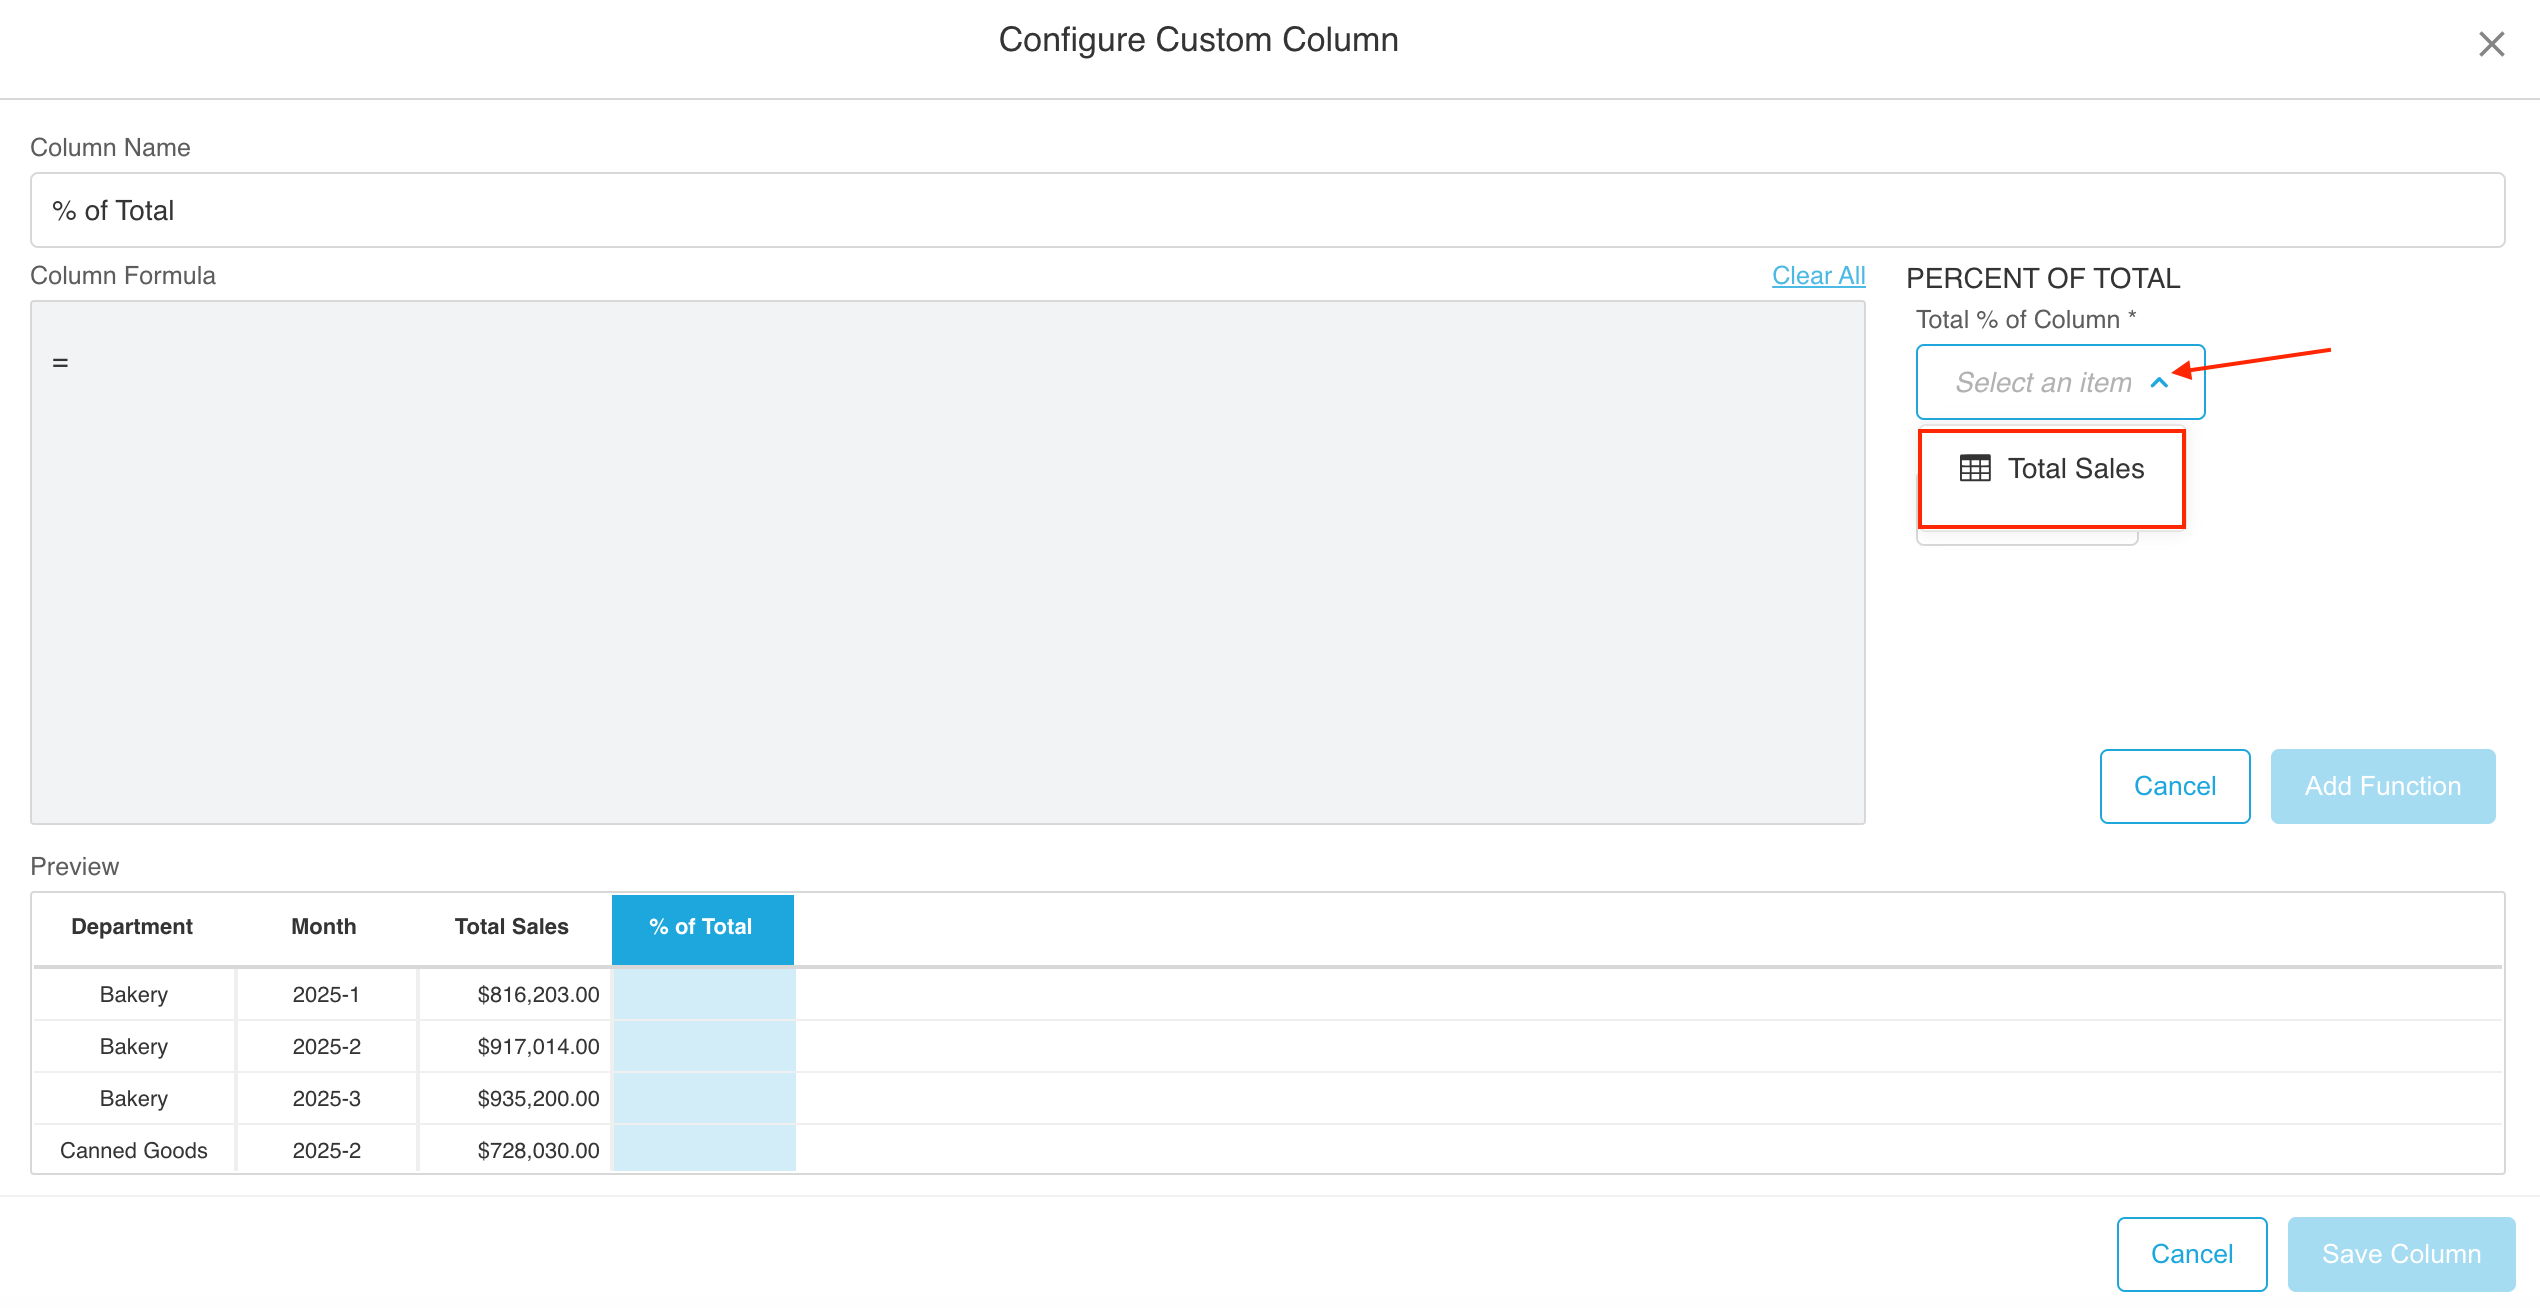
Percent of Total: Calculates each row’s value as a percentage of the total for the group or dataset.
Rank: Assigns a ranking to each row based on a chosen metric, with the highest value ranked #1.
Moving Average: Calculates the average value over a rolling window of rows (e.g., past 3 periods).
Cumulative Sum: Adds up values sequentially, row by row, within a group or across the dataset.
Cumulative Percent: Shows the running percentage of a cumulative total.
Change: Calculates the difference between the current value and a previous one in the dataset.
Advanced Functions (Adv Functions): AVERAGE, COUNT, CUME DIST, DENSE RANK, FIRST VALUE, LAG, etc.

- Select a Column to Apply the Function To
This is the target column, like Sales, Orders, or others, depending on your query.
Example with the Percent of Total for the Total Sales column:
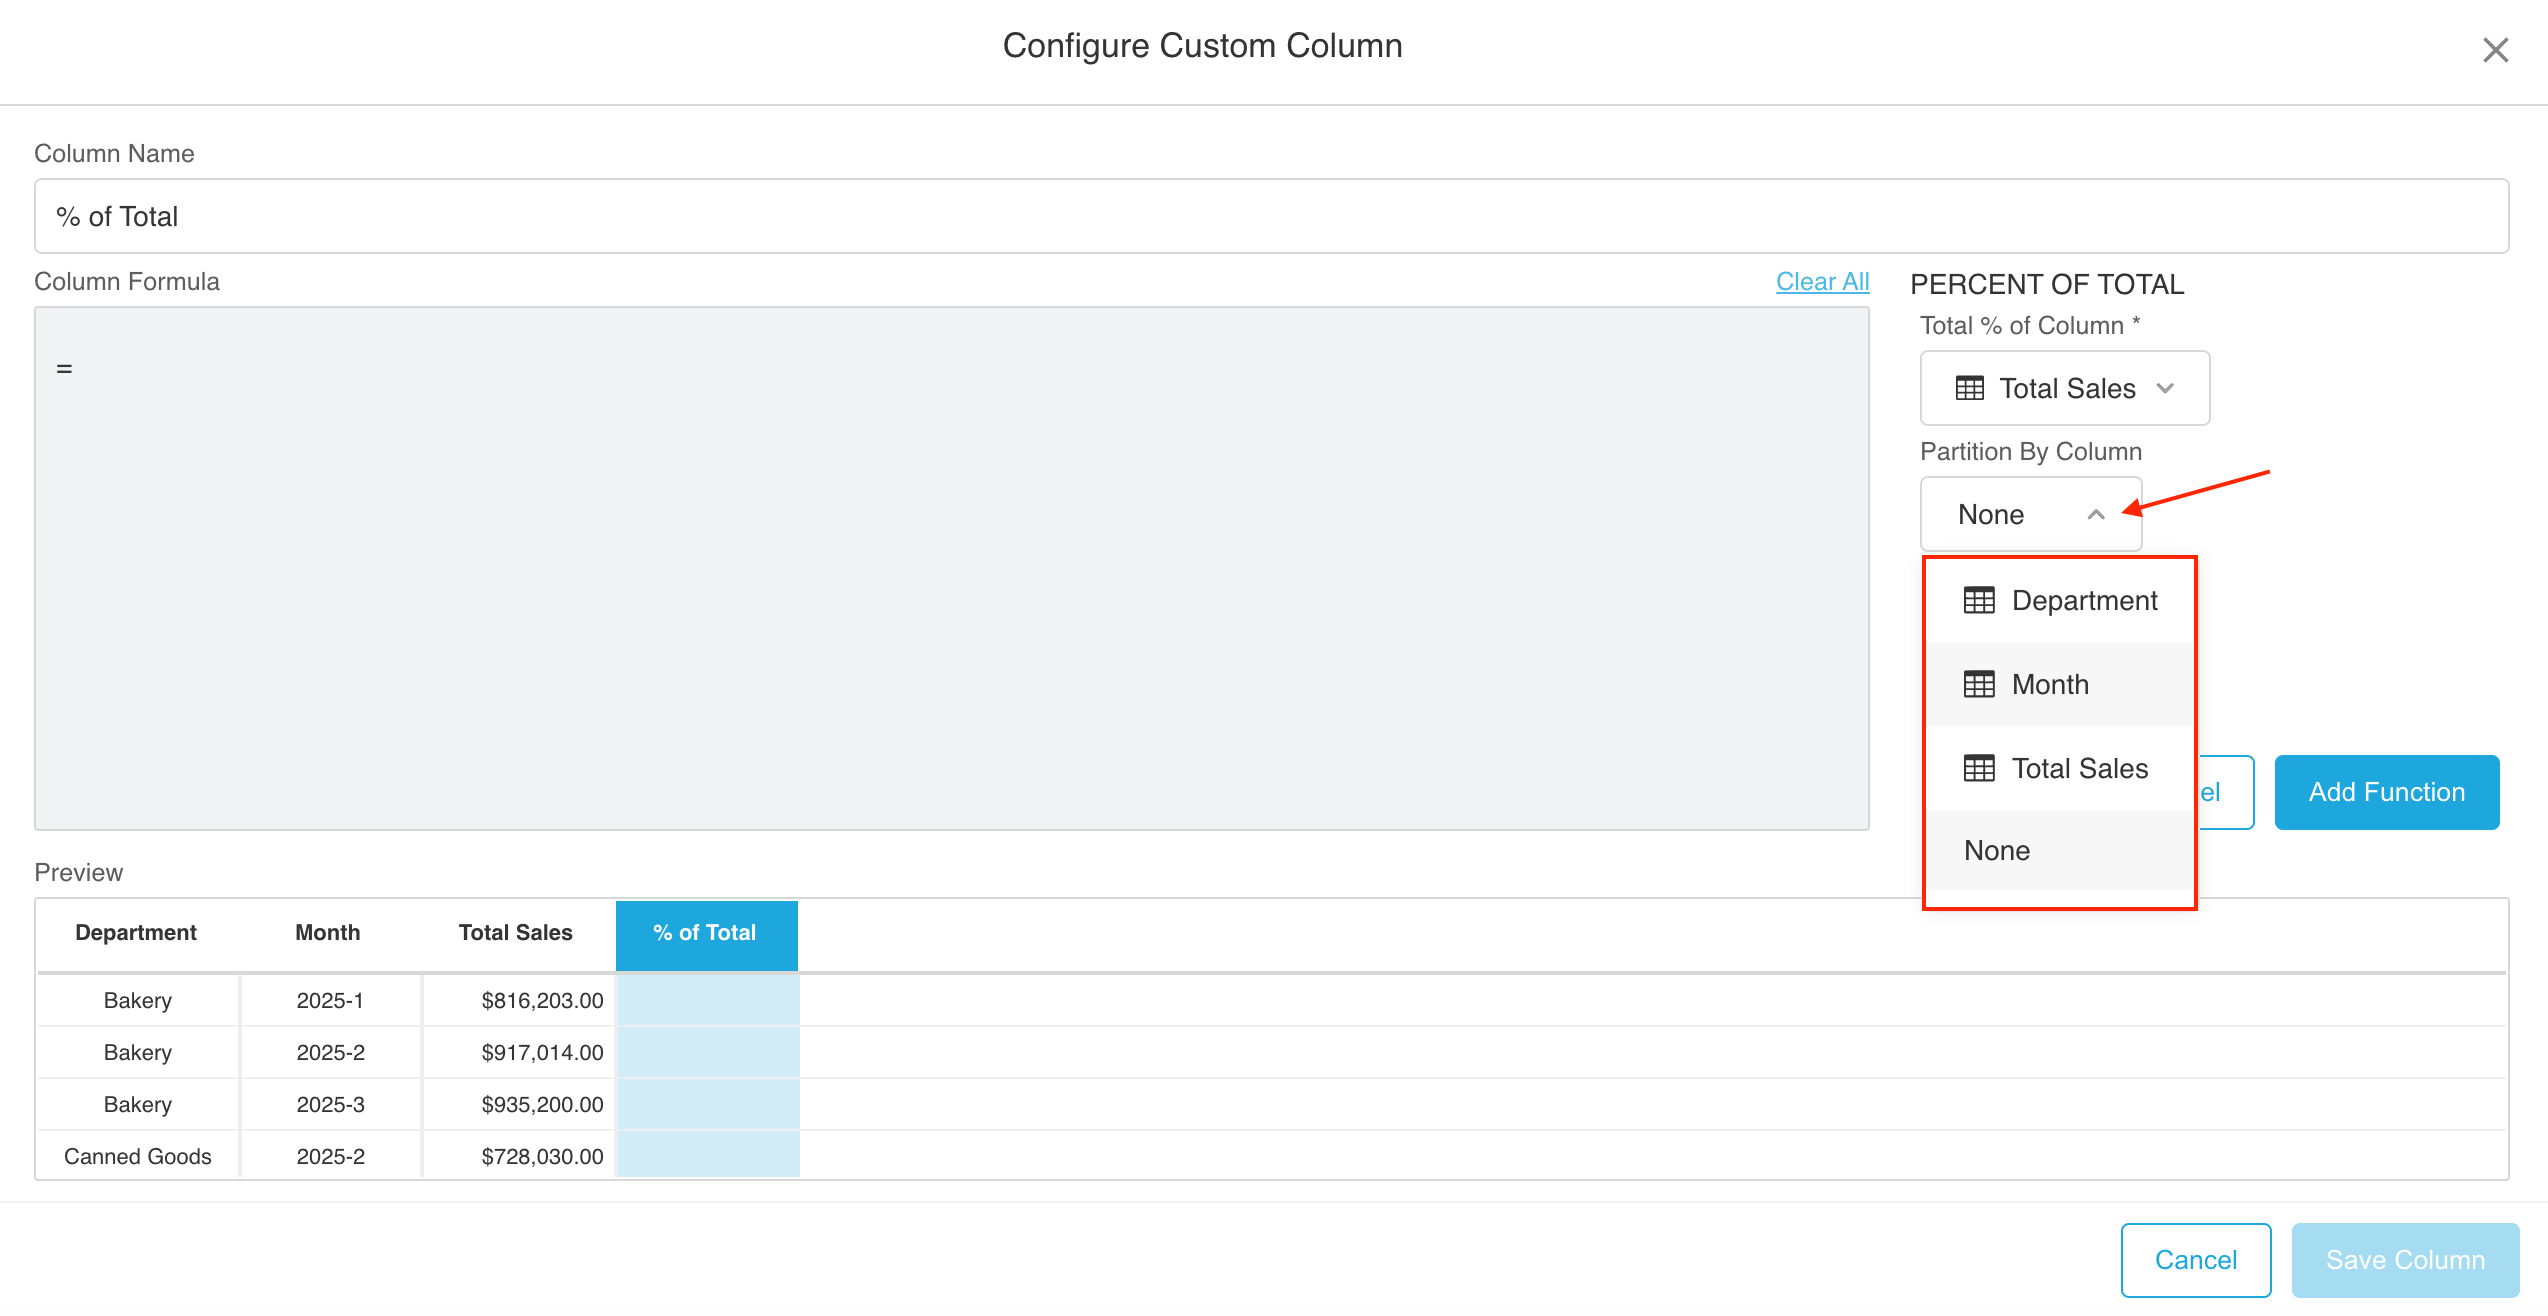
- Set the Partition (if required)
Define how the data should be segmented (e.g., by Month, by Region).
This determines the scope of the calculation.
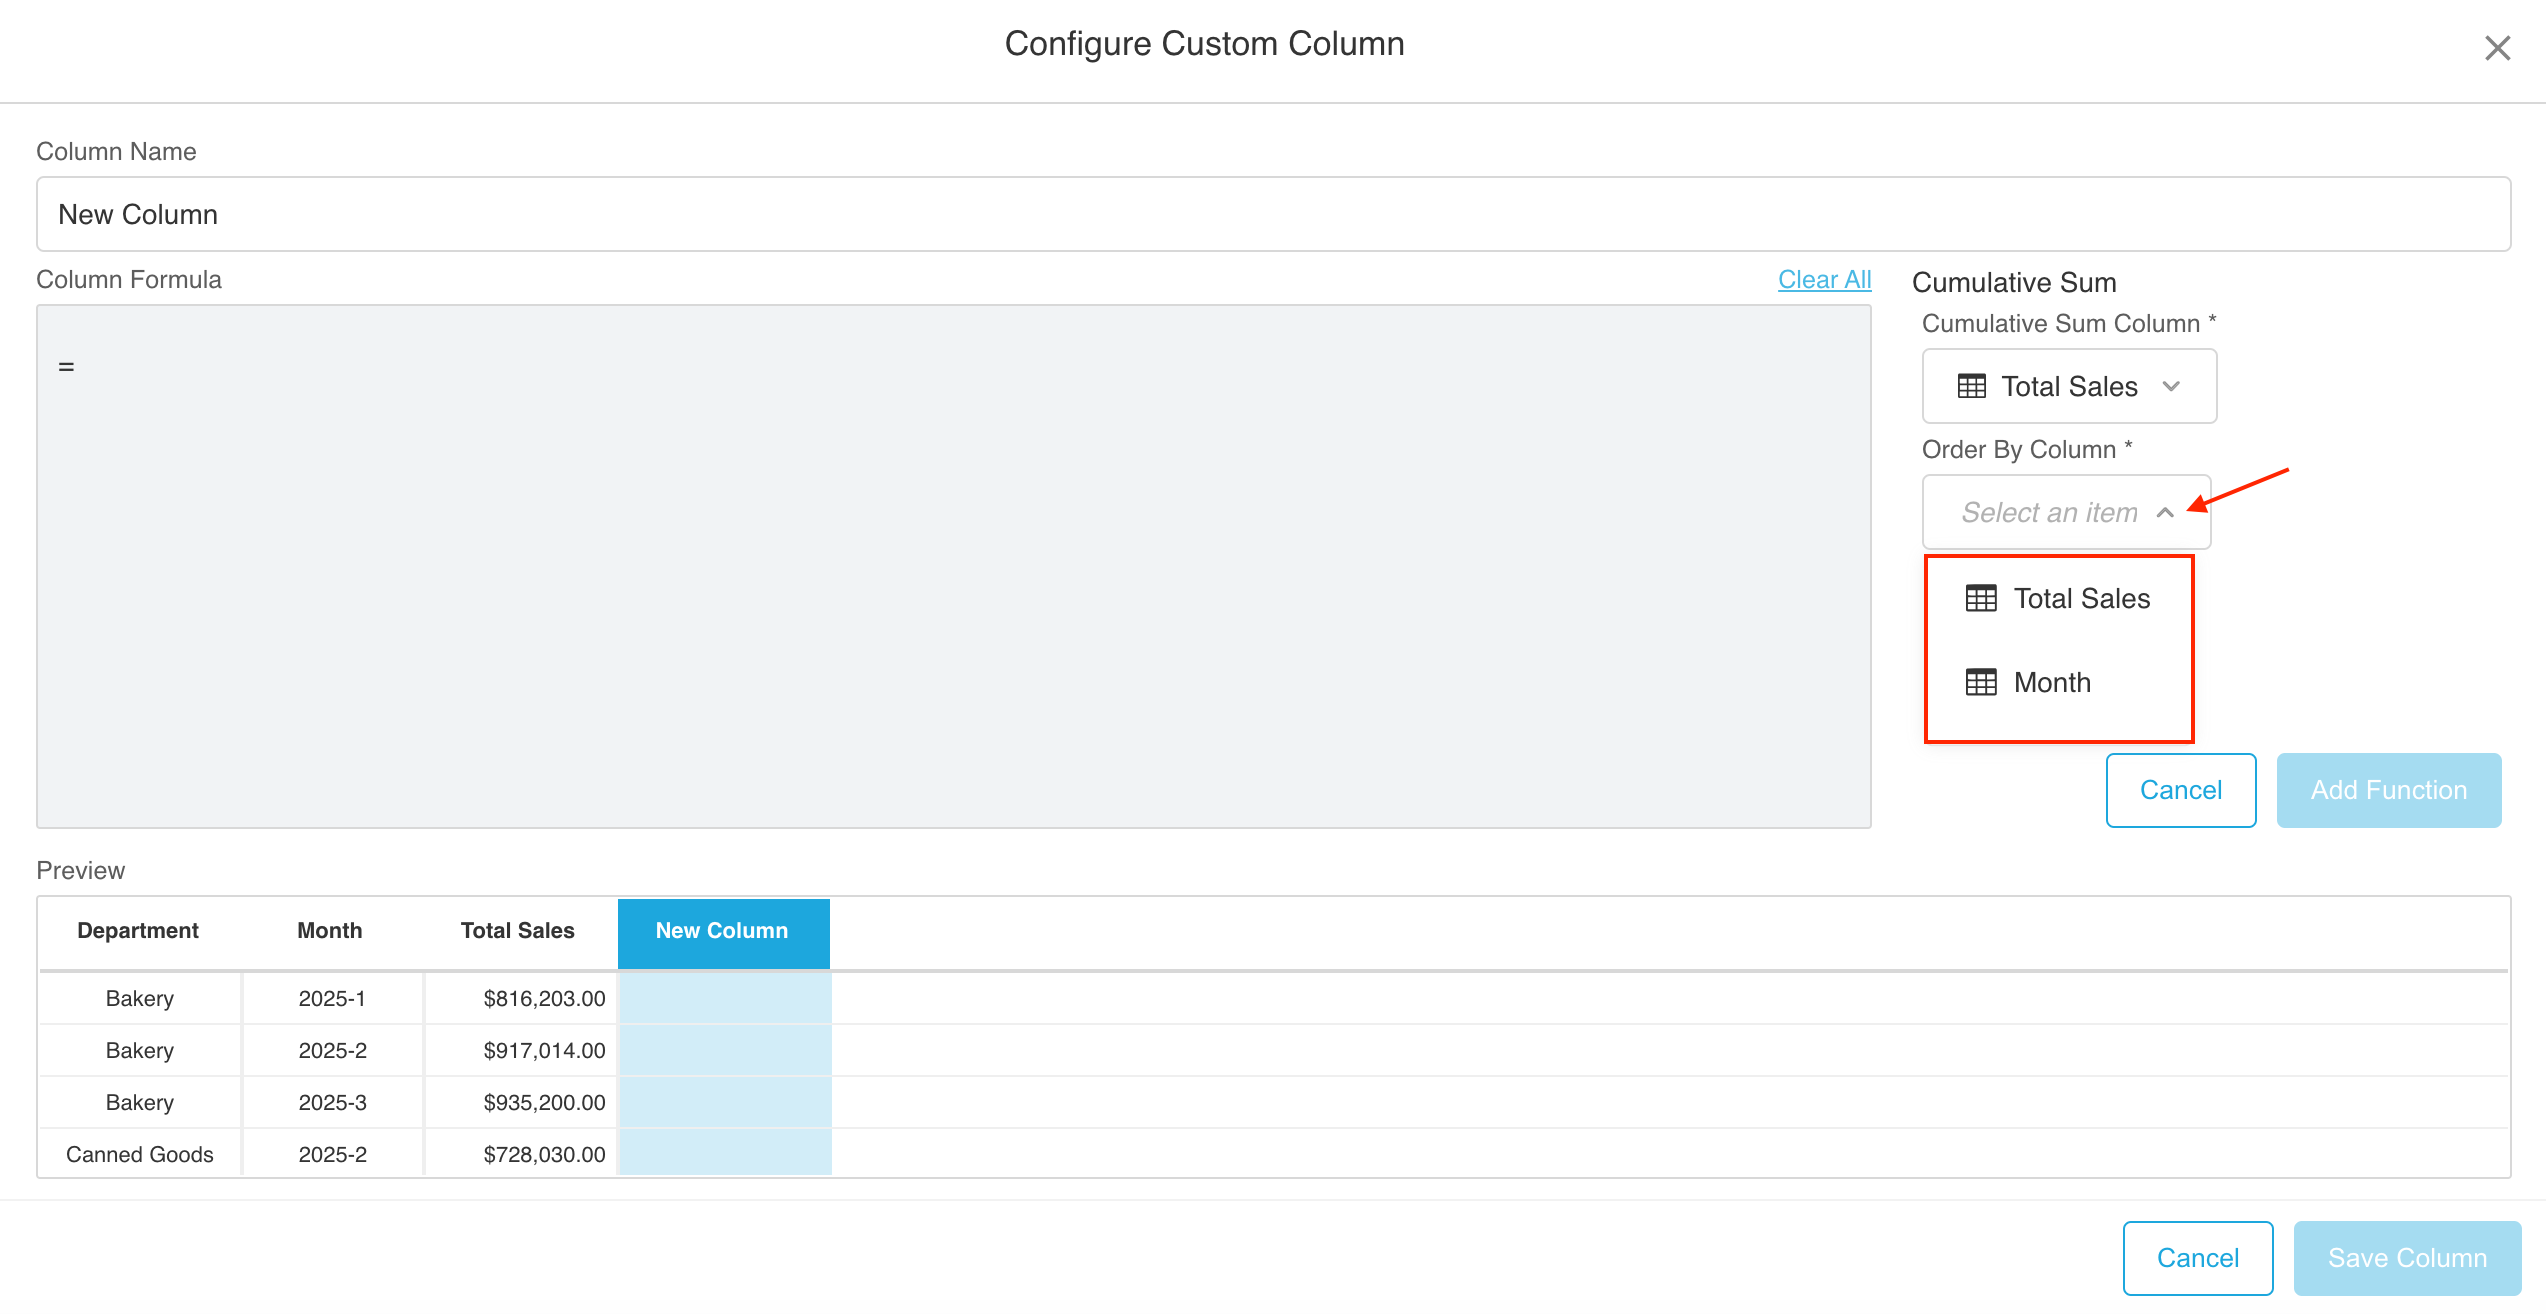
- Set the Order (if required)
Choose how the rows should be ordered within each function.
Example with the Cumulative Sum:
- Save a Column
Add a column name. Click the Add Function and the Save Column button.
The new column will appear next to your original data, applying the function row by row with the selected grouping/partition.
Updated 11 months ago